

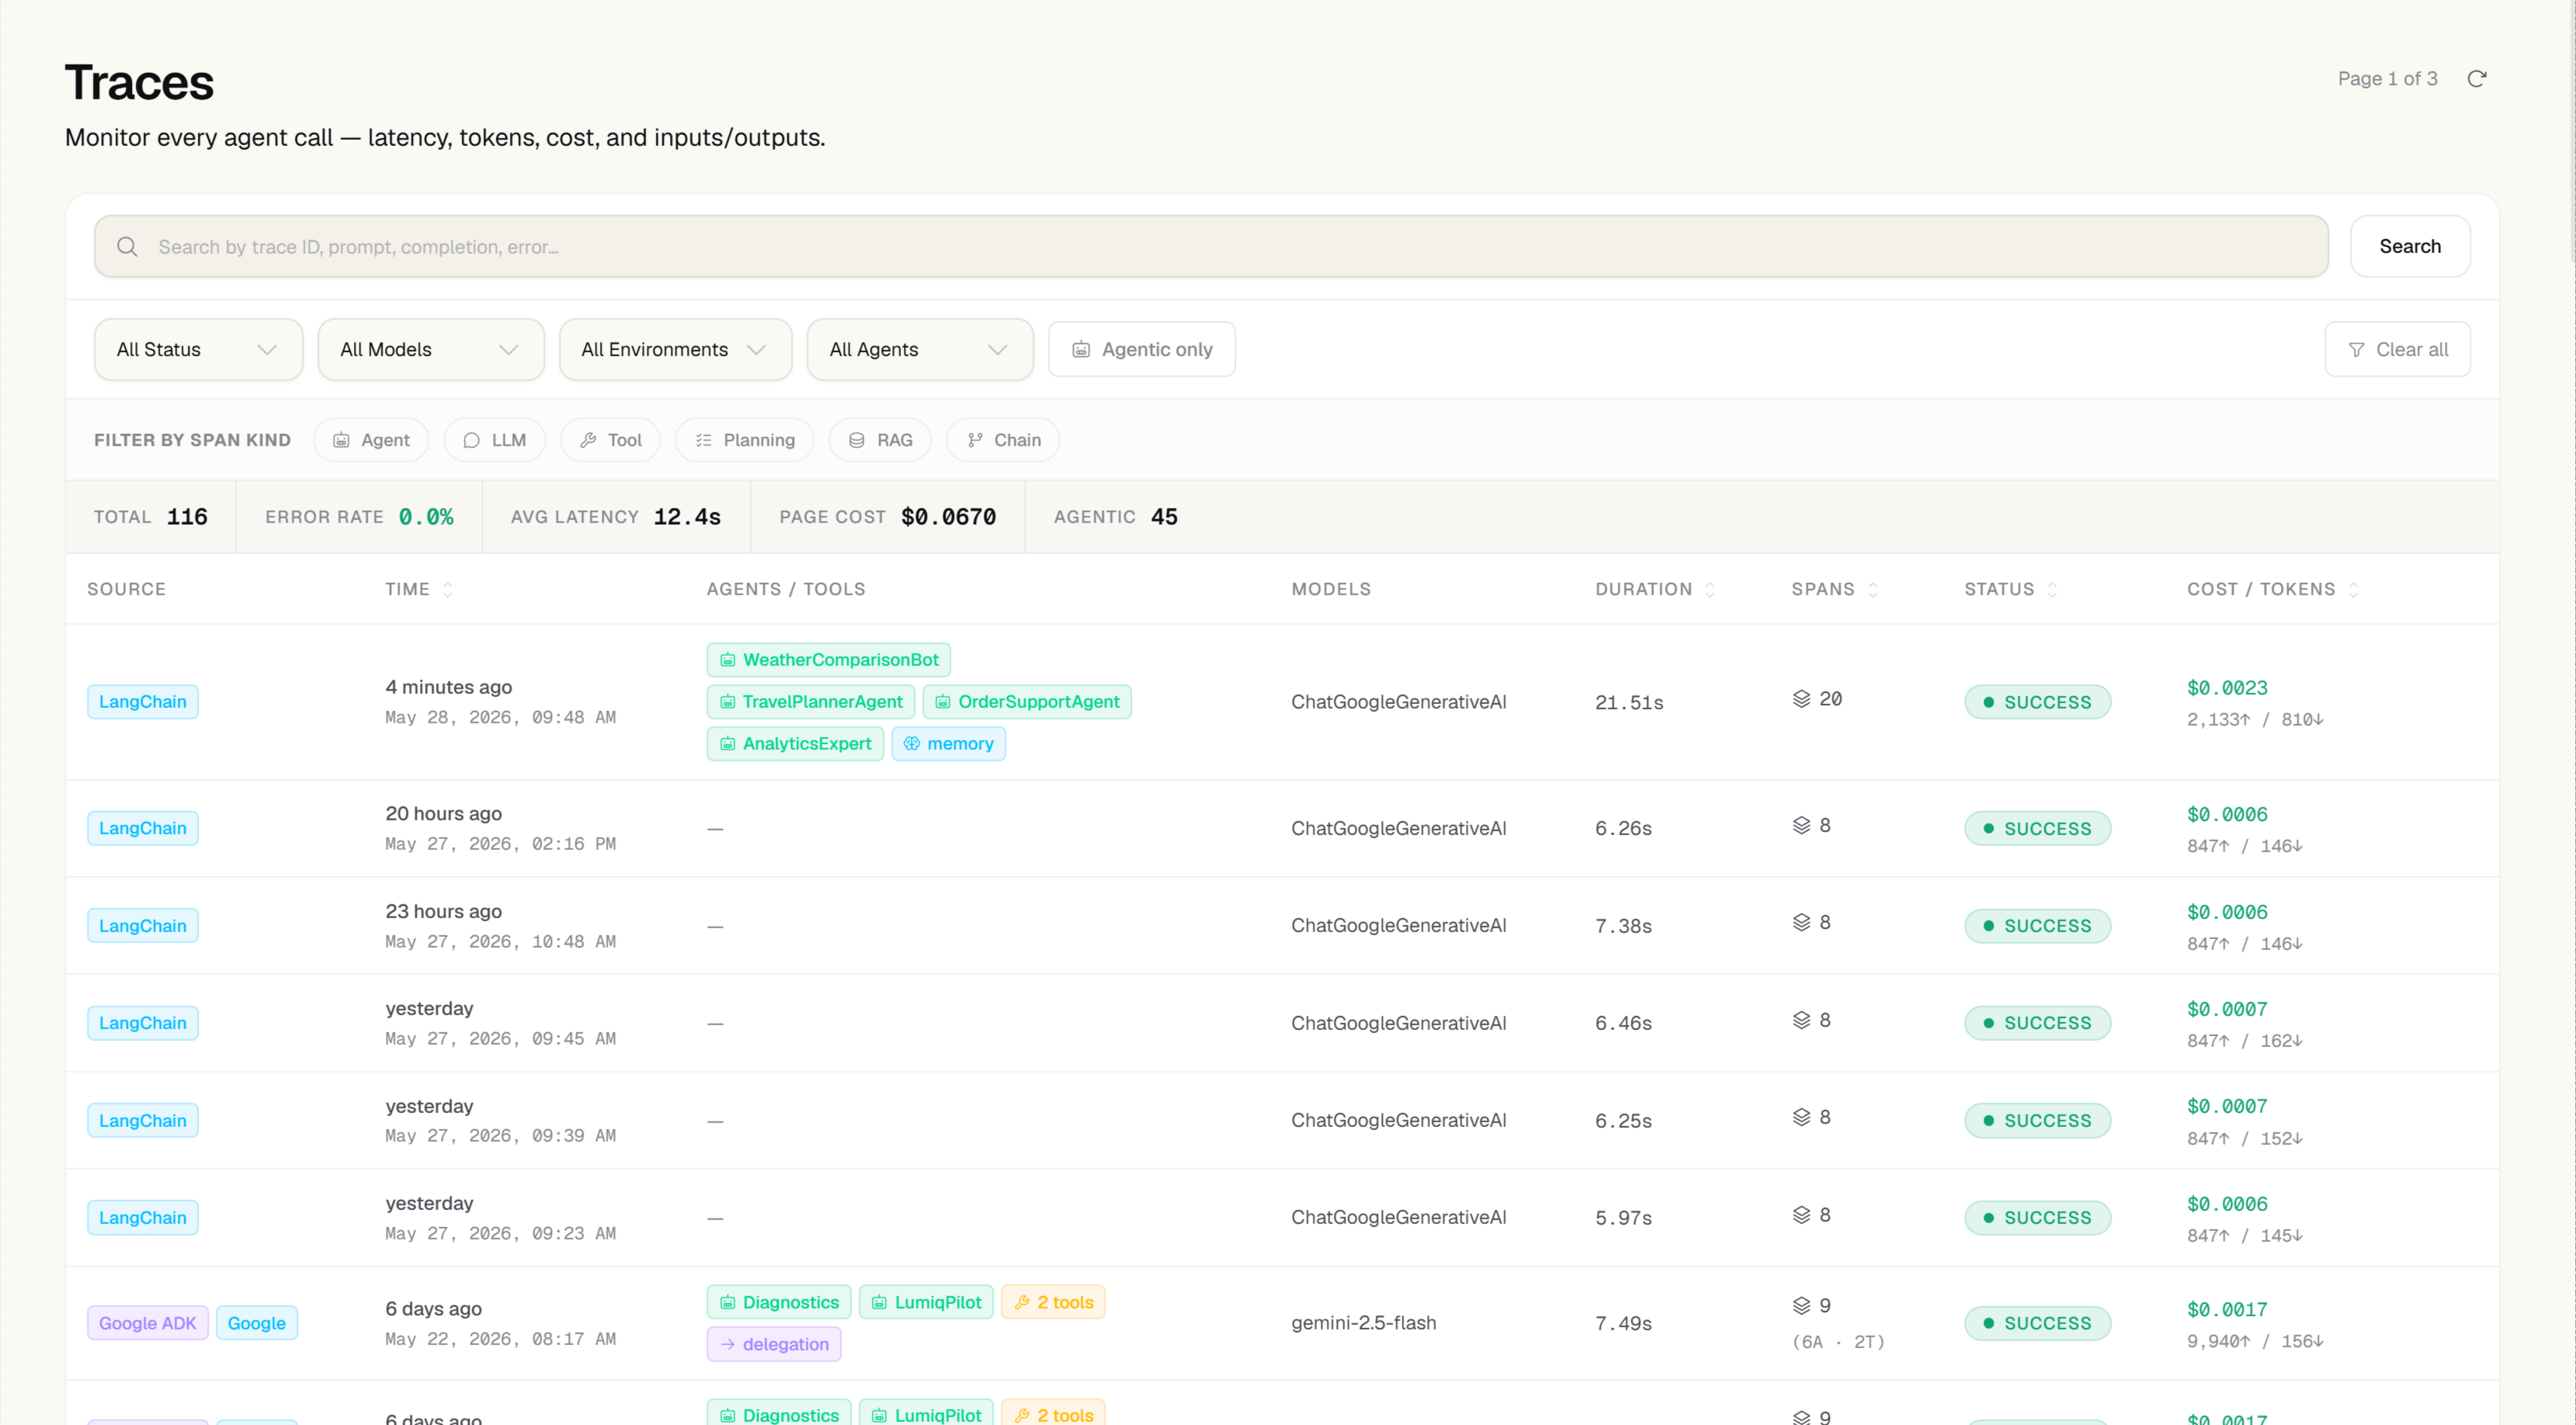
Requests log
The requests log shows all spans recorded for your project. Each row represents a single operation and shows:Filtering
The filter bar lets you narrow the list by model, status, date range, environment, and user ID. Filters combine freely and the table updates immediately.Pagination
The table uses cursor-based pagination returning up to 200 events per page. Cursor pagination ensures consistent results even if new agent events arrive while you are browsing.Opening a trace
Click any row to open the trace detail view — the redesigned layout described below. If the operation is part of a multi-span agent run, every span is available in the span navigator and the flow/flame visualizations: agent turns, tool calls, retrieval steps, and every LLM interaction.Trace detail
The trace detail view opens top-down from a one-line judgment to the exact span that caused it.Verdict
At the top, a verdict banner states in plain English whether the run was Healthy, Degraded, Failed, or Running — with a headline that names what happened (“Trace failed —check_refund_eligibility timed out on all 3 attempts”) and a short summary. It’s computed instantly and deterministically from the run’s spans, statuses, latencies, and eval results — the same classifier that powers verdict-based Issue clustering, so a trace and its Issue always agree.
- Jump to broken step takes you straight to the span the verdict blames (the deepest failing span, or the slowest tool on a degraded run).
- Explain generates an LLM narrative on demand — see Root cause below. The instant verdict is free; the LLM narrative runs only when you ask.
Convert to Scenario
The trace detail header includes a Convert to Scenario button alongside Replay and Add to dataset. It turns this one trace into a regression test: a dedicated one-item dataset plus a ready-to-run Simulations scenario, without leaving the trace. See Convert to Scenario for what it creates and how to run it.The three lenses
A trace can pass its final-answer check and still be unhealthy underneath. The lenses panel grades the same run at three altitudes, from your evaluation scores:- Final response (black-box) — was the output itself good?
- Trajectory (glass-box) — was the sequence of steps right?
- Per step (white-box) — was each individual call correct?
Verdicts and evidence
Not everything on this panel is a graded check. Two kinds of row appear:- Verdicts — an LLM judge or a deterministic check assessed the output. These carry a pass/fail and the threshold they were scored against.
- Evidence — a behavioural signal observed how the run went without looking at what the agent said.
user_retrymeans the same question was asked more than once in a session;agent_loopmeans one tool was called three or more times in a trace.
degraded on the strength of evidence alone; that means worth reviewing, not the agent was wrong.
Span navigator
The left pane lists every span in the run. Two layouts, toggled at the top:- Waterfall — spans on a shared timeline with duration bars, so you see where wall-clock time went.
- Tree — the call hierarchy, so you see who called whom.
+1.24s). Above the tree:
- Kind pills — one per span kind present (LLM, Tool, Agent, Plan, RAG, …), each with a count; click to filter to that kind.
- All / Errors / Critical path — the critical-path filter shows only the ancestors and descendants of the failing (or slowest) span.
- Search — filter by name, agent, or kind.
Inspector
The right pane is a resizable inspector. With no span selected it shows trace-overview tabs; click a span (or a navigator row) and it becomes that span’s detail. Trace-overview tabs:
Per-span detail shows the span’s identity (its own ID and parent ID, with copy buttons and a copy-link-to-span permalink), an I/O tab (prompt, system prompt, completion, tool args/result, decision rationale, RAG chunks, and image/video generation fields), a Metadata tab, and an Evaluators tab when scores target that span.
Flow diagram
The Flow tab draws the run as a node graph — one node per span, connected by its call structure — with two layouts you toggle: Hierarchical (who called whom) and Chronological (positioned by wall-clock start). Edges are labeled by kind (delegation, tool call, infers) and colored, failed steps stand out, and each node carries an execution-order badge. Pan and zoom with the mouse, fit-to-width, lock panning, or open full screen. Click a node to inspect that span.Flame graph
The Flame tab shows span durations as stacked bars, one row per depth level, in two modes: Chronological (bars positioned by wall-clock time — gaps are real idle time) and Hierarchical (each parent’s width divided among its children by duration share — fully packed, so structure reads cleanly on a mostly-idle run). Bars are colored by span kind, with a legend that reflects the kinds actually present. Open it full screen for a taller view. Click a bar to inspect that span.Retrieval
For a RAG run, the Retrieval tab surfaces the retrieved documents — chunk text, document/chunk IDs, source, and relevance score — and a per-retrieval-span context count. Retrieval is captured automatically by the LangChain and LlamaIndex integrations, or explicitly for manual RAG viarecordRetrieval() / record_retrieval(). This is the same context the RAG evaluators score.
Session context
When a trace belongs to a session (an SDK-suppliedsession_id), the Session tab shows the whole conversation: a rollup (user, turn count, total duration and cost) and every sibling trace in the session — the current one highlighted — each linking to its own trace. Traces without a session don’t show the tab.
Guardrail violations in the trace
When a guardrail check blocks, warns, or redacts something during a run, the violation appears as its own span in the navigator and the flow/flame views — positioned as a child of the span it evaluated, colored to match the guardrail outcome, right alongside the tool call and LLM spans instead of in a separate log you have to cross-reference. Select the guardrail span to see which policy fired, the check phase (pre or post), and the exact value that triggered it. From there, click Promote to Policy to turn that one violation into a permanent guardrail rule — the tool, field, and value are pre-filled from the violation itself. See Promoting a violation to a policy.Delegation compliance
When a span showsDelegated from <agent name>, a compact badge next to the agent’s name (in the Agents tab and on the flow graph) summarizes that agent’s guardrail-compliance history: pass rate, violation count, and its most recent violation. This is pulled from anywhere in your organization — every project, not just the current one — so you can see at the moment of a handoff whether the agent you’re about to trust has a clean record elsewhere in your org.
The same badge appears on that agent’s own page in the Agent Registry.
Root cause
Click Explain on the verdict banner, or open the Root cause tab, to run an AI root-cause analysis on the full agent trace. Zespan examines all spans — timing, errors, token counts, tool call results, and agent delegation chains — and returns:- A plain-English summary of the entire agent run
- The identified root cause type (e.g.
tool_failure,token_limit_exceeded,agent_loop) - The specific problem span, and — for a multi-agent run — the causal agent: which upstream agent’s output poisoned the downstream failure, and at which handoff step
- Contributing factors across the trace
- Step-by-step fix recommendations with implementation notes
- A prevention tip