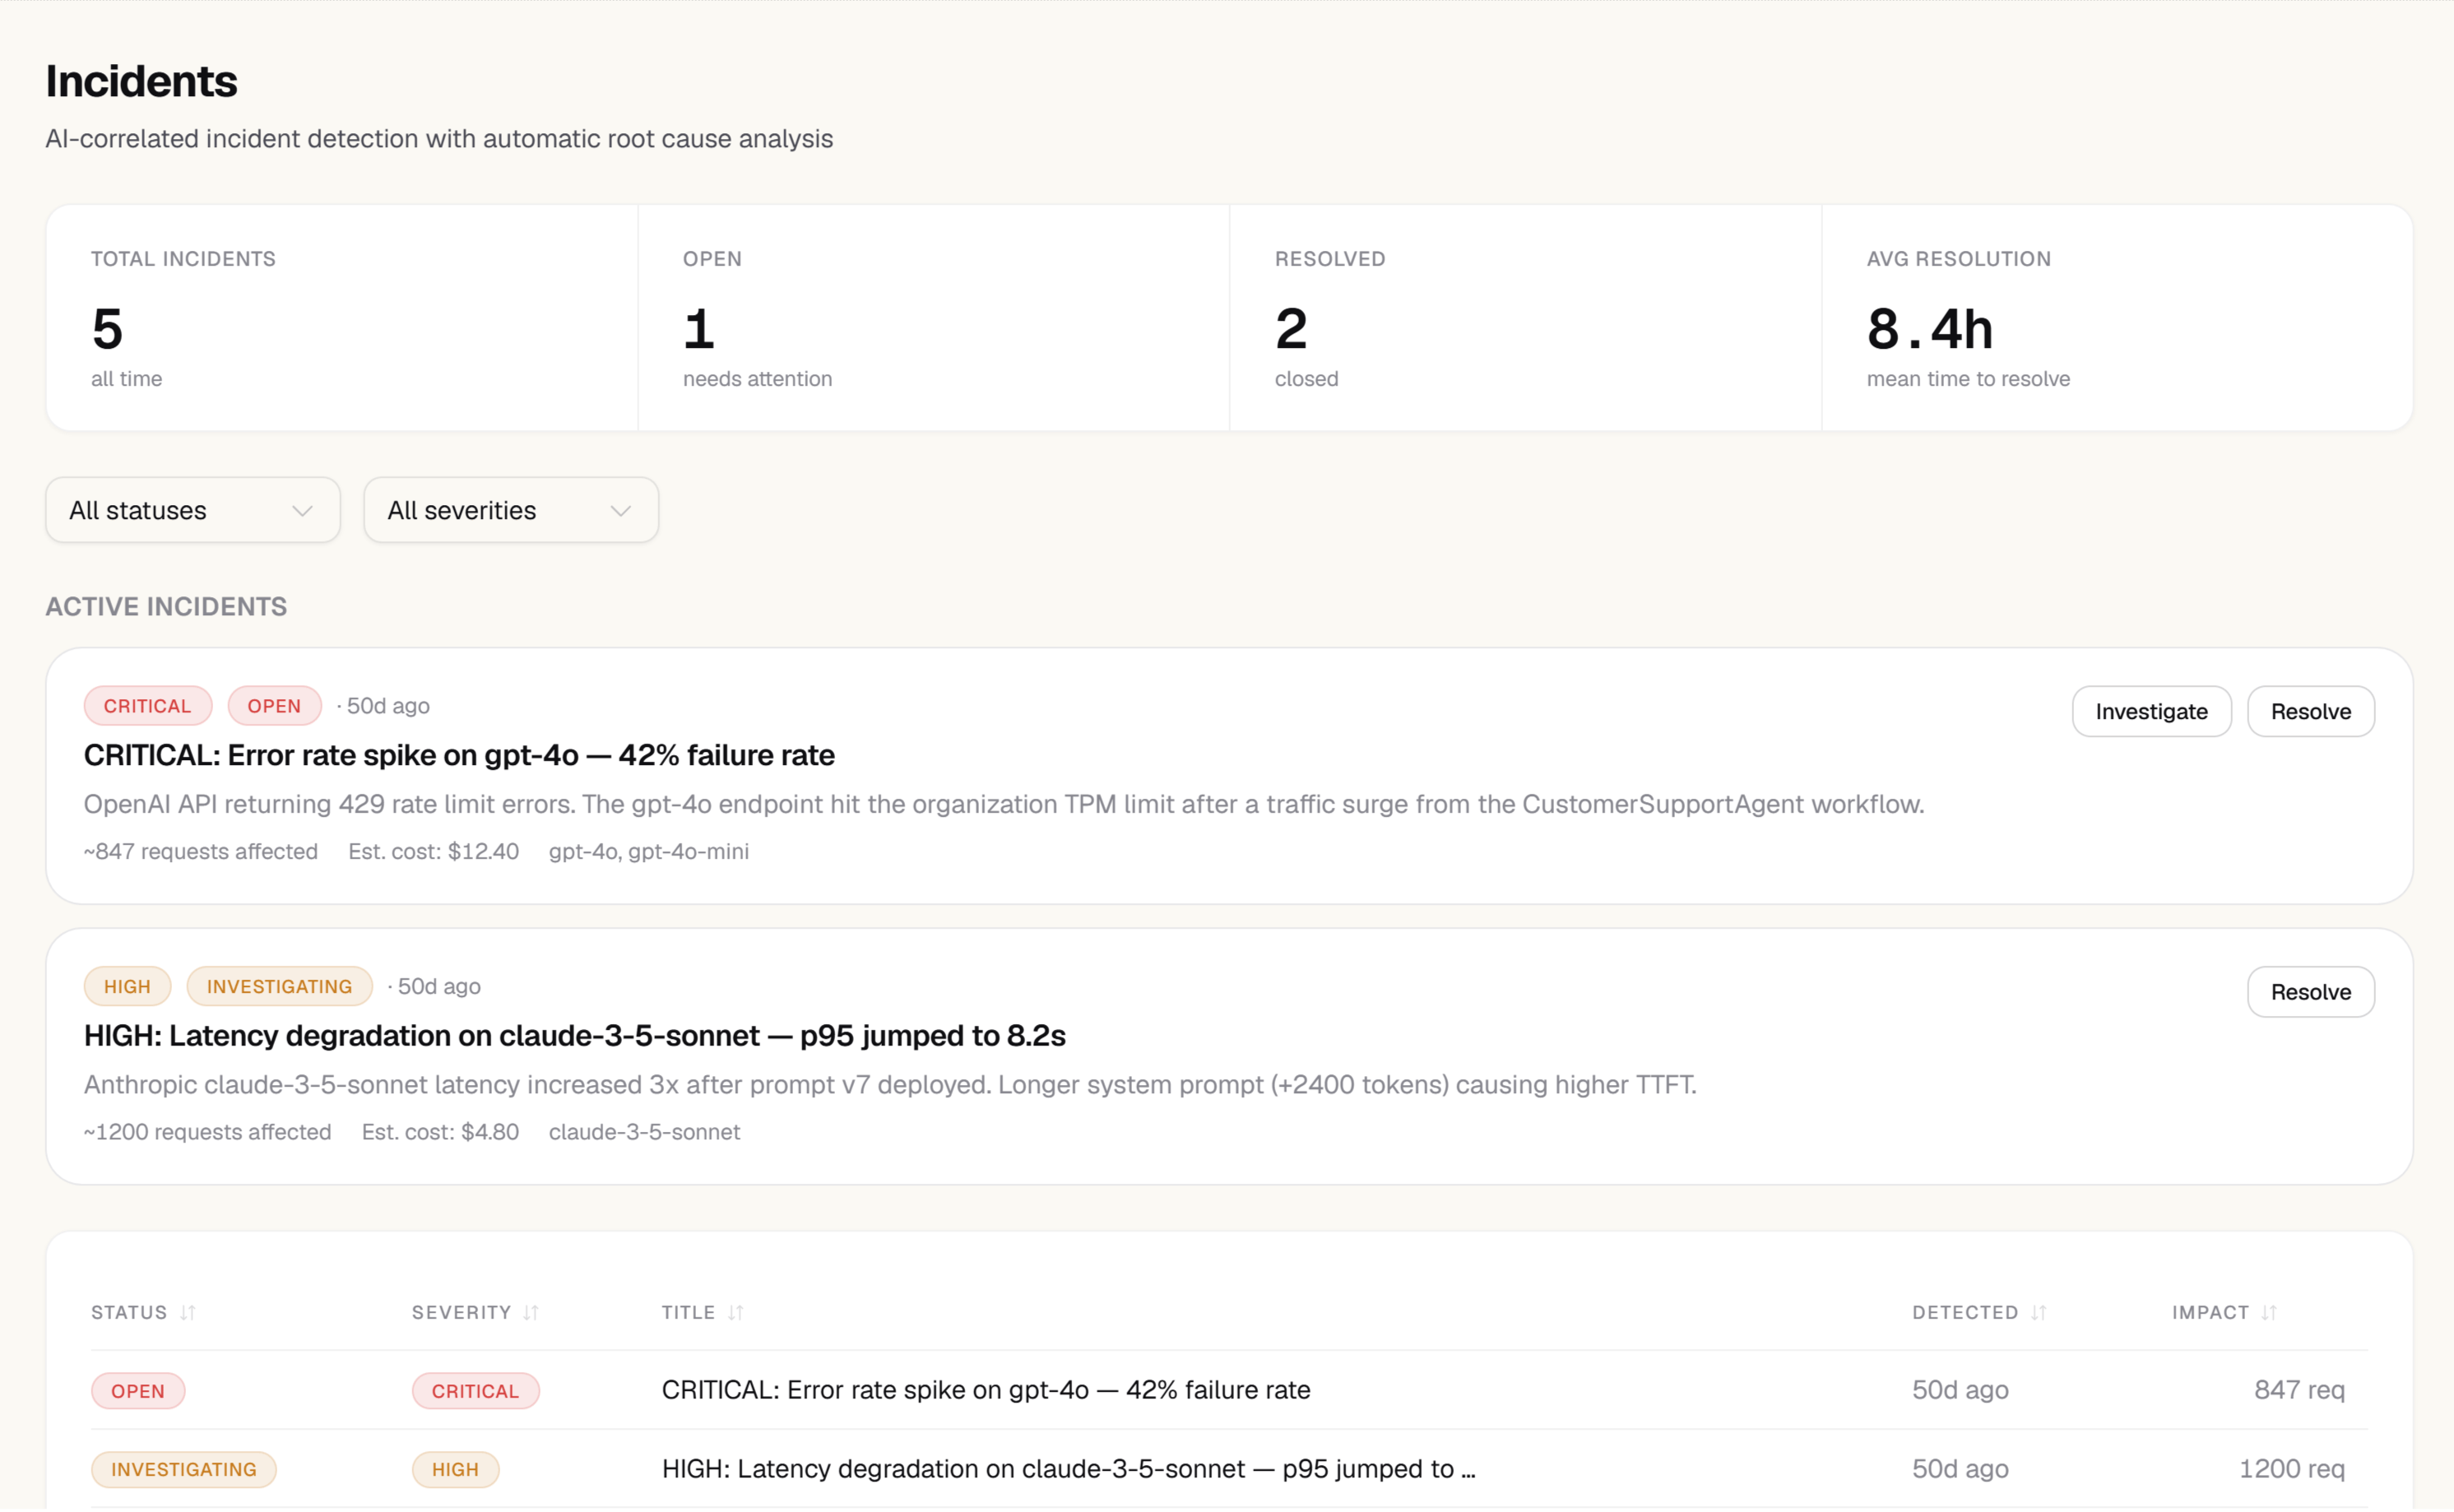
Incident detection and management require the Team or Scale plan.
How incidents are created
Zespan creates incidents automatically when:- An anomaly is detected (cost spike, error rate jump, latency surge) and a related alert rule fires within 15 minutes
- Three or more traces with the same error code occur within a 10-minute window
- An AI analysis detects a pattern across multiple traces that it classifies as a systemic issue
Incident states
Each incident moves through three states:
Zespan auto-resolves an incident when its driving metric returns to baseline for 30 consecutive minutes. You can also resolve an incident manually.
The incidents list
The main Incidents page shows a table of all incidents, ordered by most recent. Each row shows:- Severity —
high,medium, orlow, based on impact to cost or error rate - Title — a one-sentence summary of the issue
- Affected metric — which measurement is out of range
- State — detecting, active, or resolved
- Duration — how long the incident has been open
- Models affected — which model(s) are involved
Incident detail
Click any incident to open its detail view. The detail view shows:Timeline
A chronological feed of all signals related to this incident:- Anomaly detections with their explanation and severity
- Alert rule triggers with threshold and actual value
- Related error traces (grouped by error code)
- Configuration changes that may have contributed (from the audit log)
Root cause analysis
When an incident is created, Zespan automatically runs AI root cause analysis across the correlated traces. The results appear at the top of the incident detail view under AI Root Cause Analysis.
The analyzer uses a fast path for common patterns (rate limits, timeouts, context length exceeded, provider 5xx errors) and falls back to AI analysis for novel cases. Trace content is sanitized before analysis — only error details, model metadata, span structure, and latency are used.
If analysis is still running, the section shows “Analysis in progress…” and updates automatically when complete.
Affected traces
A filtered list of the specific traces associated with this incident, with error codes, latency, and cost. Click any trace to open it in the flame graph view.Resolution notes
A free-text field where you can record what you found and how you fixed it. Resolution notes are preserved after the incident closes and appear in the incident history. Use them to build a runbook for recurring issues.Resolving an incident
Click Mark resolved on any active incident. You’ll be prompted to add a brief resolution note. Once resolved:- The incident state changes to “Resolved”
- The resolution timestamp and note are saved
- If the same underlying issue recurs, a new incident opens automatically — it does not reopen the closed one
Auto-remediation
On the Scale plan, you can configure auto-remediation rules that ZespanPilot applies automatically when an incident of a specific type opens. For example:- “When a GPT-4o error spike incident opens, switch to GPT-4o-mini”
- “When a rate-limit incident opens, reduce sample rate to 50%”