Enforce
block mid-run
block mid-run
Verdict
pass / fail, deterministic
pass / fail, deterministic
Cluster
group recurring failures
group recurring failures
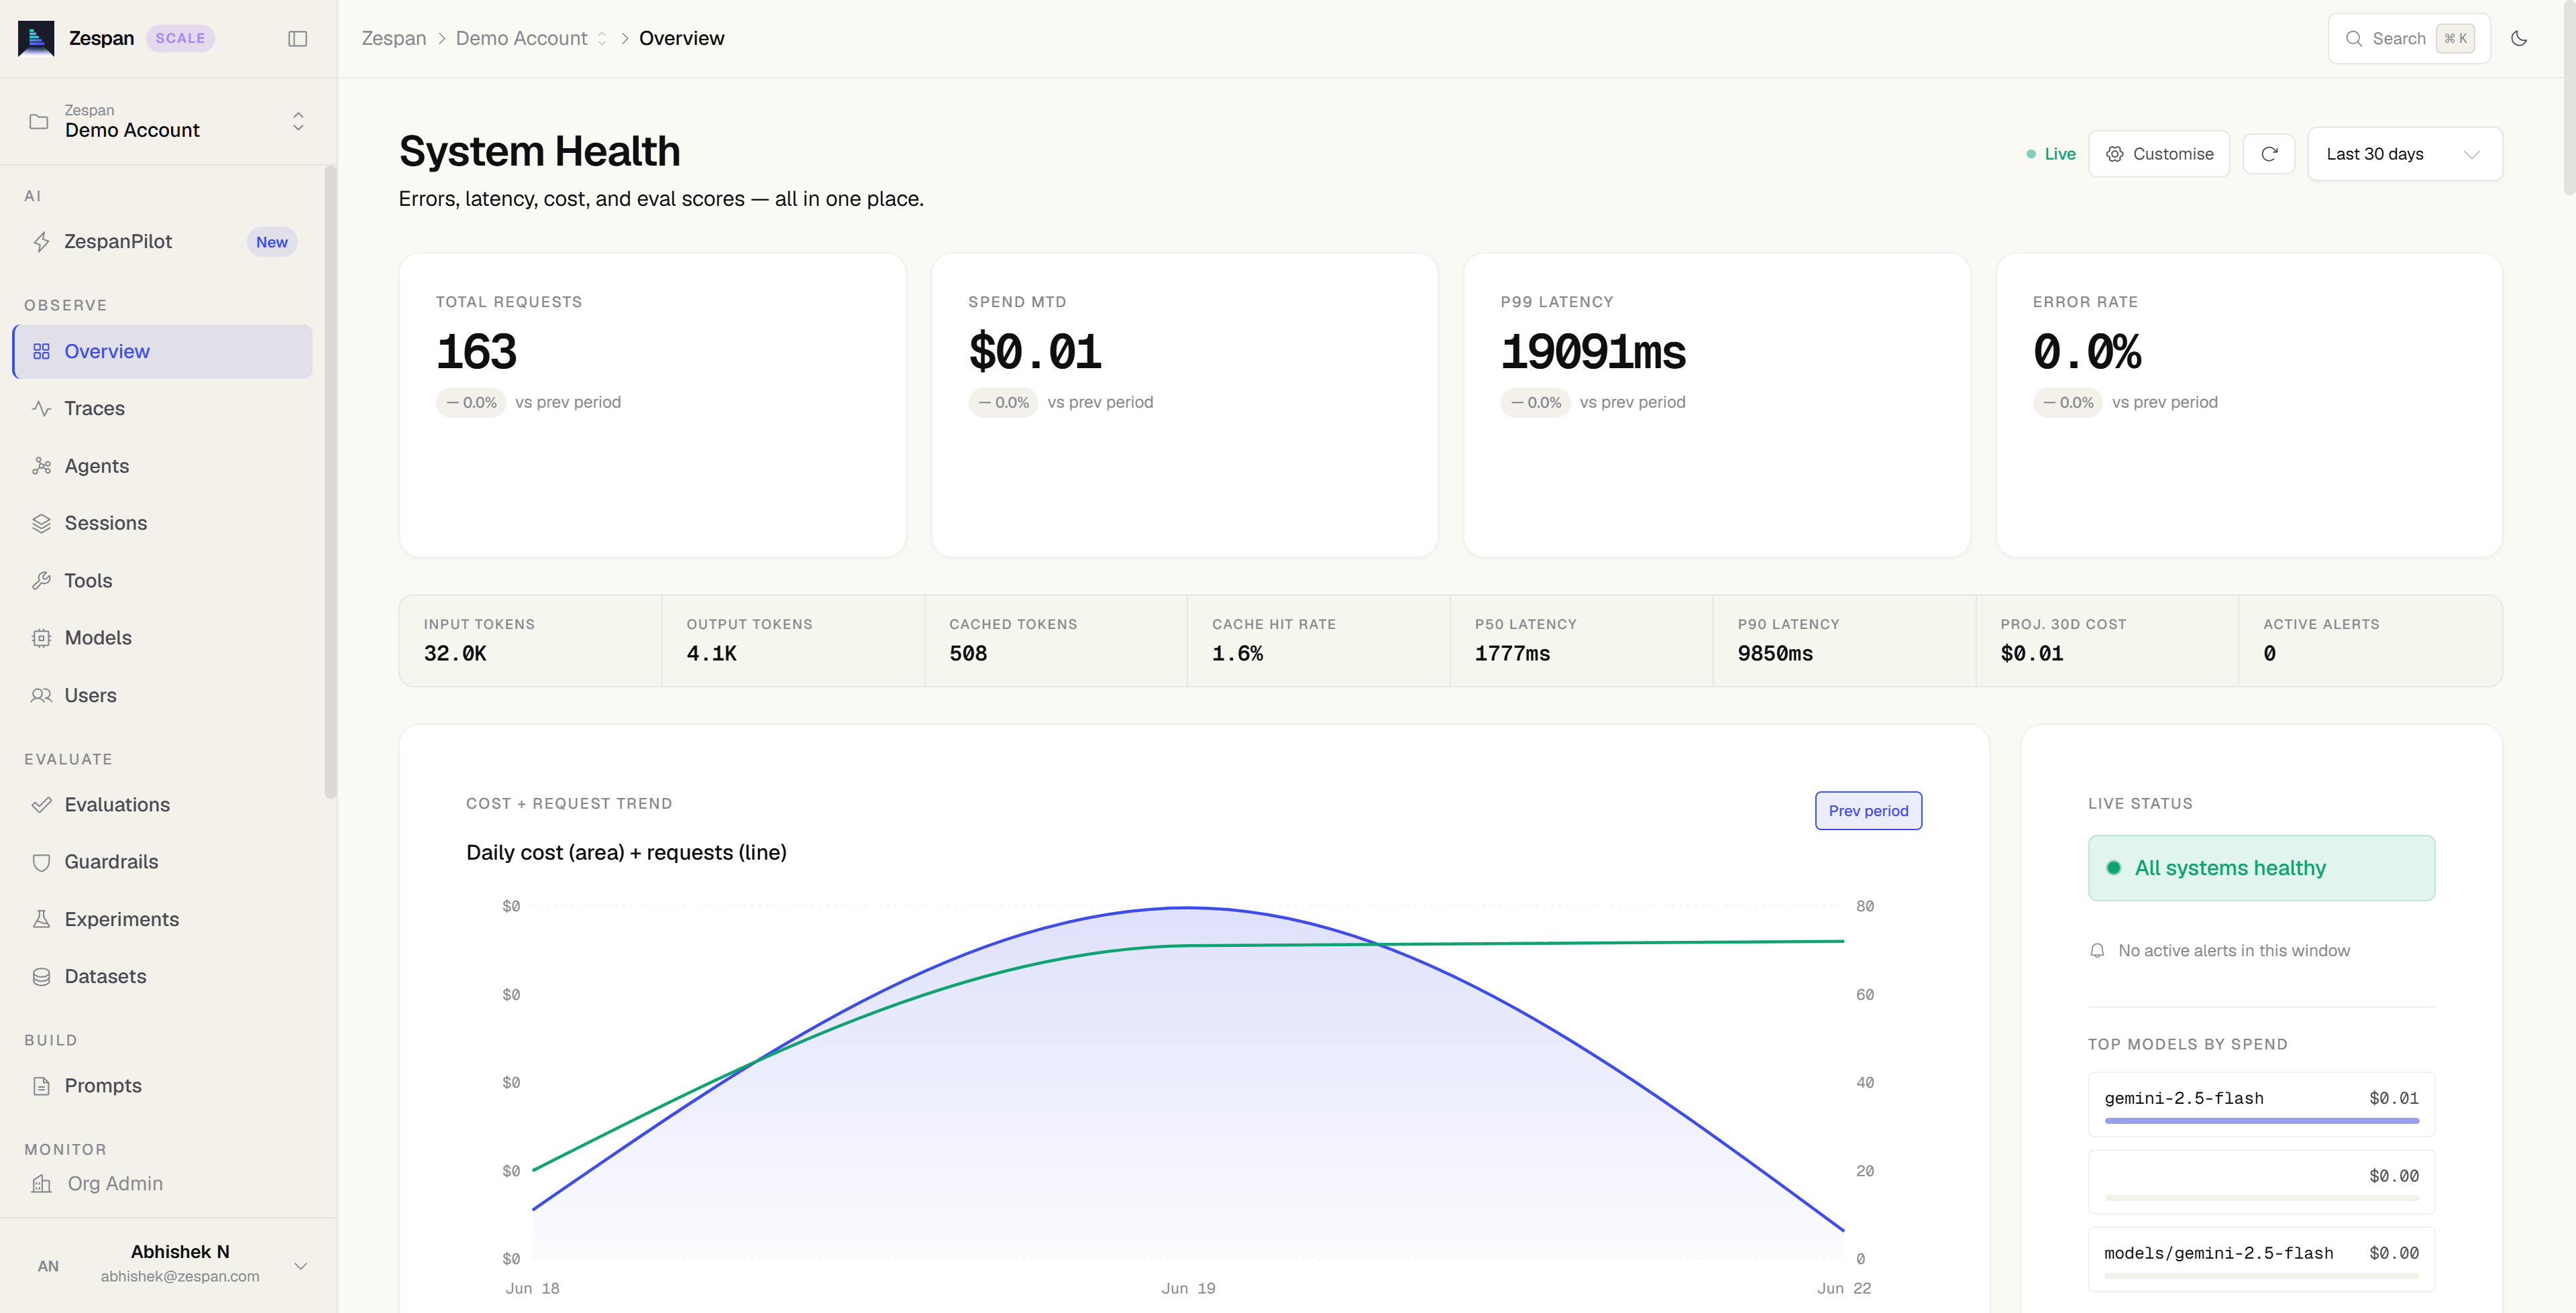
What makes an agent reliable
Runtime enforcement, in-process
Block an agent mid-run on loop, scope, budget, or delegation policy — a library call inside your own process, no proxy, no separate gateway contract.
Deterministic pass/fail verdicts
Every trace arrives pre-classified — response, trajectory, or step level — so you know whether a run actually succeeded, not just what it cost or how long it took.
Recurring failures, clustered automatically
The same deterministic verdict system groups repeated failures into a single tracked Issue, so you stop re-discovering the same bug one trace at a time.
Full agent traces
Follow a user request across every agent turn, tool invocation, sub-agent delegation, and LLM call. The flame graph shows each span’s latency, cost, and status.
Multi-agent visibility
See coordinator-to-specialist handoffs, parallel agent runs, and delegation chains, plus a cross-project trust ledger on every agent’s guardrail-compliance history.
Cost attribution
Token costs attributed per agent, per tool, per model, per user, and per session — plus a cost-vs-quality frontier that flags a cheaper model scoring just as well.
Who Zespan is for
Zespan is built for engineers and teams building production AI applications with agents. If your application makes LLM calls, uses tools, orchestrates multiple agents, or runs RAG pipelines, you need more than visibility into what happened — you need the ability to stop a run before it does damage, and a straight answer on whether it succeeded. Zespan gives you both, with two lines of SDK setup. You don’t need to change how you build your agents. Wrap your existing LLM clients and frameworks, and Zespan instruments everything automatically — including LangChain chains, Google ADK agents, and custom multi-agent systems.Pricing
Zespan charges per organization. Start on the Free tier with no credit card required, then scale up through Solo, Pro, and Team plans as your agent traffic grows, or talk to us about a custom Scale plan for high-volume and enterprise needs.Compare plans
See the full plan comparison, trace quotas, and overage rates on the Billing page.
Ready to start?
Instrument your first agent and see it in the dashboard in under five minutes.Quickstart
Install the SDK, wrap your agent or LLM client, and see your first trace appear in the dashboard.