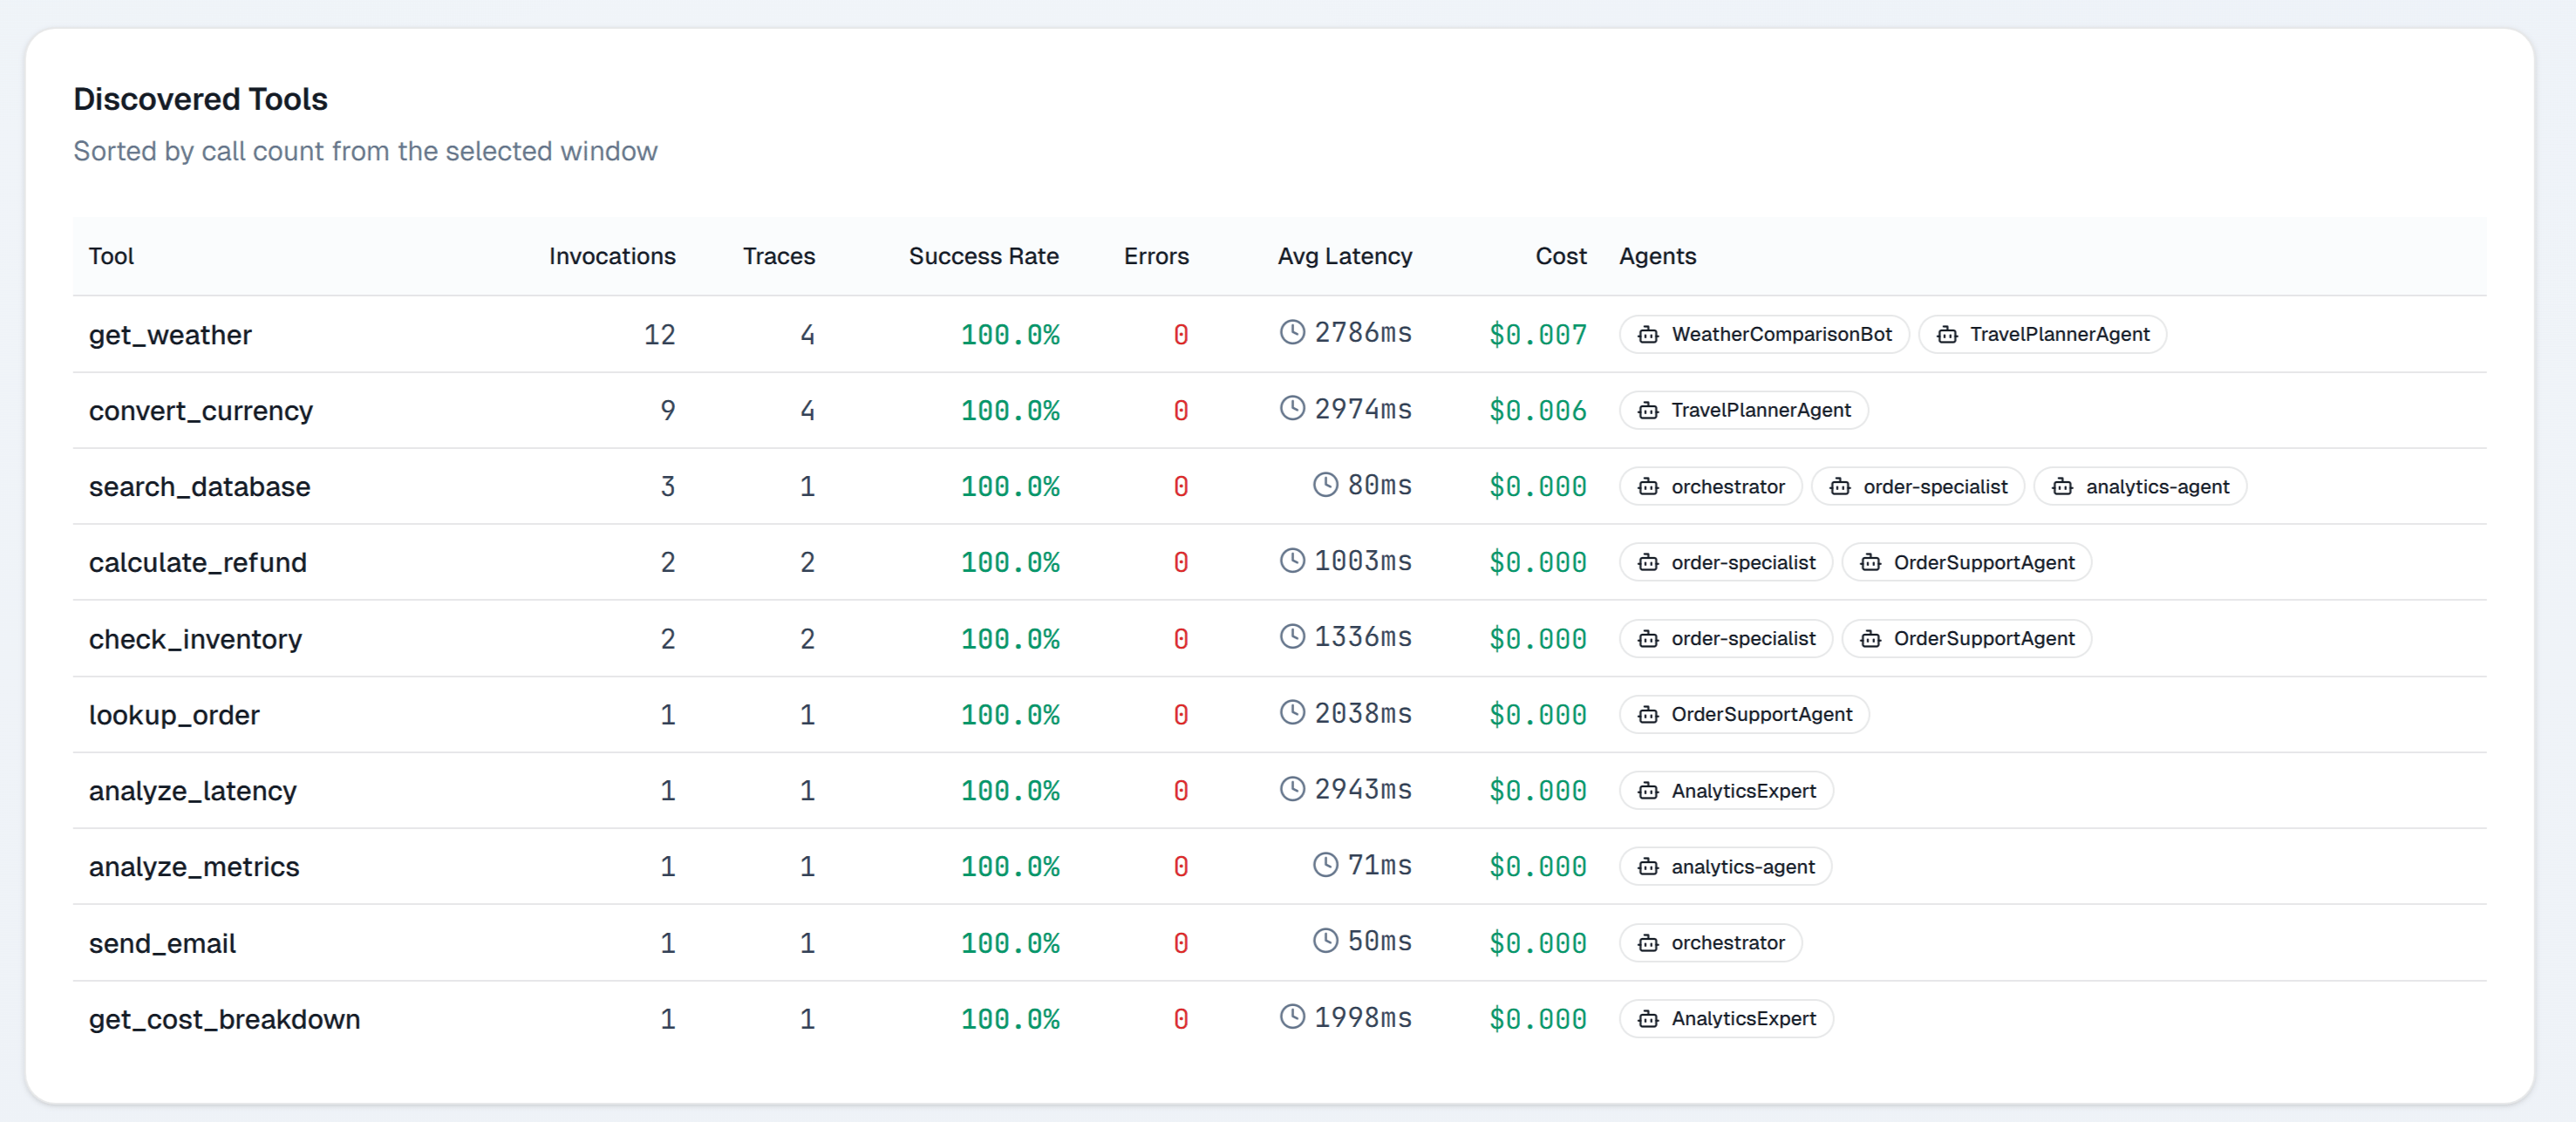
Tool list
The tool list shows all tools called in the selected time range:
Sort by failure rate to prioritize reliability work. Sort by avg latency to find performance bottlenecks.
Tool detail
Click any tool to open its detail page.Call history
A paginated list of recent calls with timestamp, agent, input arguments (ifstorePrompts is enabled), return value summary, latency, and outcome.
Latency distribution
A histogram of call durations. A bimodal distribution (two peaks) often indicates cache hit vs cache miss behavior or fast vs slow execution paths.Calling agents
A ranked list of agents that call this tool, with per-agent call counts and failure rates. If one agent has a much higher failure rate than others calling the same tool, the issue is likely in how that agent constructs the tool arguments.Tool span types
Zespan records tool calls as spans of kindtool. Retrieval operations (vector search, document fetch) are recorded as spans of kind retriever. Both appear in the Tools view.
See Span kinds for the full list of span types and what each captures.
Registering tools in code
Tools appear automatically when your agent makes calls that the SDK recognizes as tool spans. For custom tools, wrap the tool function with a manual span:Next steps
- Traces — inspect individual tool calls in context
- Manual spans — instrument custom tools
- Span kinds — span type reference