

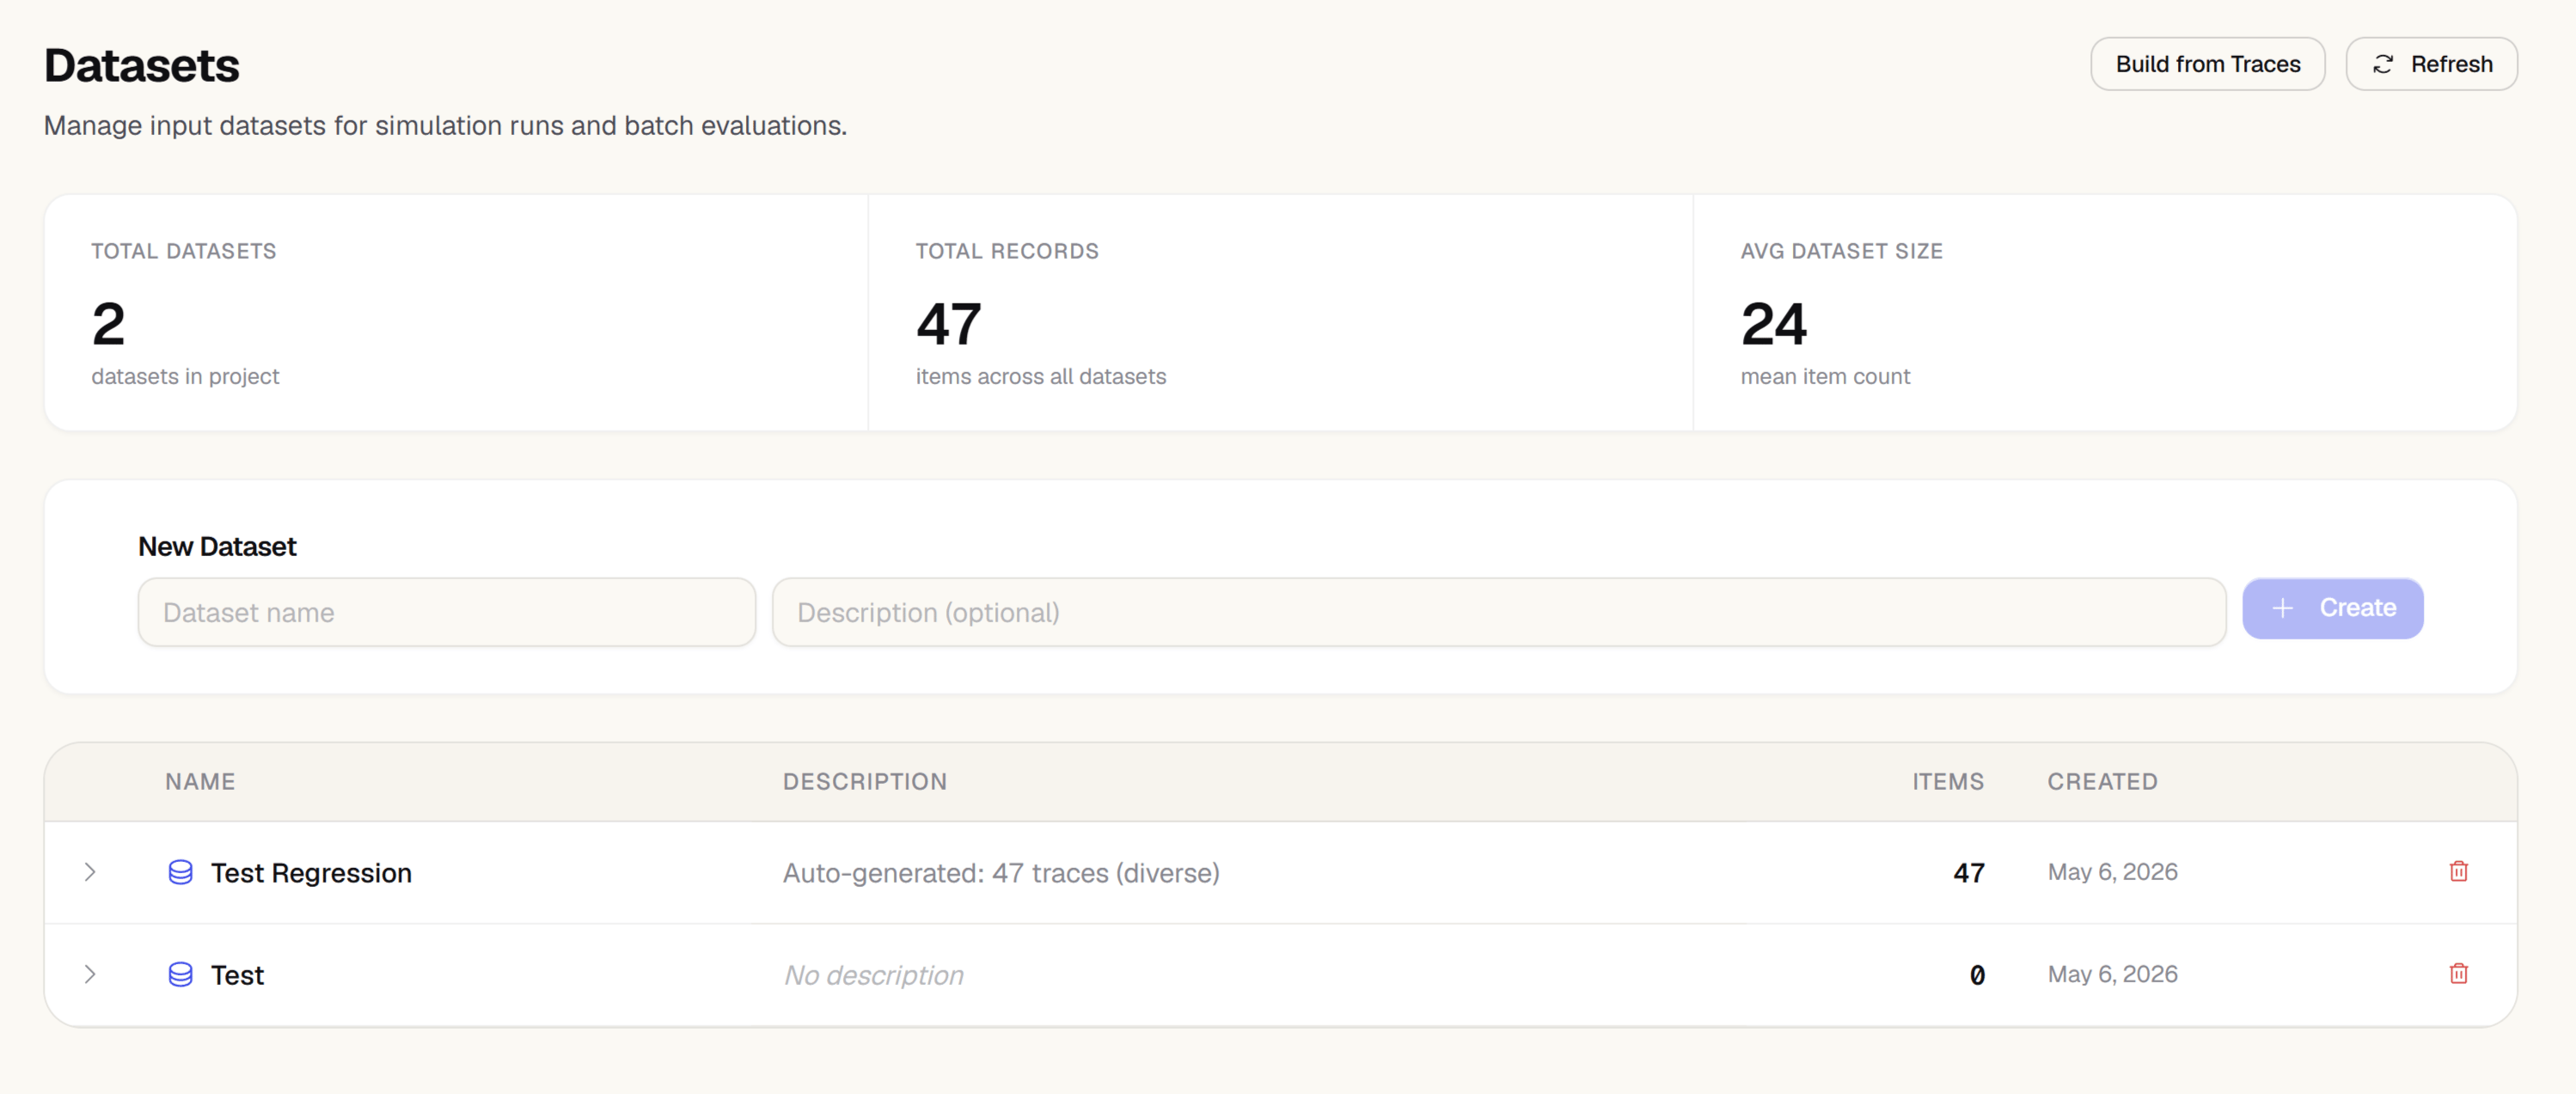
Creating a dataset
From traces
The fastest way to build a dataset is from existing traces:- Open Traces and filter to the runs you want to evaluate
- Select one or more trace rows using the checkboxes
- Click Add to dataset → choose an existing dataset or create a new one
By uploading CSV
Upload a CSV file with columns matching the dataset schema. Required columns:
Only
input is required — a row with no output or expected value is still added to the dataset.
Go to Datasets → New dataset → Upload CSV and select your file.
Manually
Add rows one at a time using the Add row button. Useful for small curated datasets of known edge cases. Once a dataset has items, Zespan doesn’t run anything against it directly — your own code links a run’s results back to the dataset, then you score that run from the dashboard. See How dataset runs work and Scoring a run below.Dataset versioning
Each dataset has a version history. When you add or remove rows, the previous version is preserved. Evaluation runs are tied to a specific dataset version so results remain reproducible.How dataset runs work
A dataset run lets you evaluate a pipeline that lives entirely in your own code — a production service, a batch job, a scheduled script, anything that can call the Zespan SDK — instead of asking Zespan to execute it for you. Unlike Simulations, which Zespan runs on your behalf, dataset runs let you bring your own pipeline: your code fetches the dataset’s items, calls your own LLM or agent with each one (producing a Zespan trace the same way your integration always does), and links that trace back to a named run. Zespan never executes anything here — it only records the link between a dataset item and the trace your code produced, then scores the linked traces with an evaluator you choose and lets you compare two runs side by side.Running against an HTTP endpoint
Two execution modes are the exception to “Zespan never executes anything here”: running a candidate prompt version, and running a registered HTTP Target. Both let Zespan produce the run itself, without your own pipeline code in the loop, from the same “Run over dataset” flow — pick which one to use with the Prompt version / HTTP endpoint toggle. An HTTP Target is a registered, externally-hosted agent endpoint — a deployed Bedrock or Glean agent, or any chatbot API you don’t control or can’t instrument with the Zespan SDK. Instead of calling an LLM provider directly (as the prompt-version mode does), Zespan POSTs each dataset item’s hydrated request straight to the endpoint you registered and records the raw response as a trace taggedsdk_name: "zespan-http-endpoint". See HTTP Targets for how to register one, its security model, and how traceparent propagation works.
Linking a run from your code
A typical job does three things:- Fetch the dataset’s items with the SDK — each item includes its
inputand, if the dataset has one, itsexpectedOutput. - Create the run. Calling this again with the same name later (for example, the next time the job starts) just re-attaches to the existing run instead of creating a duplicate.
- For each item, call your own pipeline as normal, then link the item to the run using the trace ID your call just produced. Pass an
observationIdas well if you want to point at one span within the trace rather than the trace as a whole.
For the full SDK walkthrough — run handles,
observationId, and wiring this into a quality gate — see Dataset runs in the SDK.Scoring a run
Once your job has linked every item, score the run from the dashboard:1
Open the Runs view
Open the dataset and click the Runs tab. Find the run your job created — it’s created the first time your code calls
createRun/create_run.2
Pick an evaluator
Choose which evaluator to score the run’s linked traces with.
3
Click Score
Zespan looks up each linked trace and scores it with the evaluator you chose. A per-item score appears next to each dataset item, along with the run’s overall average once scoring completes.
Scoring a run calls the evaluator’s LLM judge, which requires a project LLM connection. Without one, scoring fails with “No LLM connection configured — add one in Settings → LLM Connections.” Connect a provider key under LLM Connections first.
Comparing two runs
To see whether a change to your pipeline — a new prompt version, a new model, a new retrieval step — actually did better on this dataset, compare two runs directly:1
Open the Runs view
Open the dataset and click the Runs tab.
2
Select two runs
Select the two runs you want to compare — for example, your previous run and your new candidate run.
3
Review the comparison
Zespan shows a side-by-side table of every dataset item both runs cover, with each run’s linked trace and score next to each other, plus each run’s overall average. Regressions (10+ point drops) are listed first, improvements (5+ point gains) after.
4
Export a report (optional)
Use Export CSV or Export HTML at the top of the comparison view to save the same regressions-first breakdown as a file — CSV for spreadsheet analysis, or a self-contained HTML file you can open directly in a browser or attach to a PR/Slack message without needing to log in to Zespan.
Regression testing from production failures
Every recurring production failure — clustered as an Issue — automatically becomes a regression test case once it’s happened 3 or more times. There’s no persona-writing involved: the test case is the incident that already happened to real traffic.How it works
1
Auto-capture
A background worker captures recurring issues into a “Production Failures (auto-captured)” dataset once they’ve recurred 3 or more times.
2
Replay via your own CI
Point your CI’s existing dataset-run flow at that dataset — the exact same linking mechanism described above. This is bring-your-own-execution, same as every other dataset run: Zespan never executes your agent.
3
Verdict comparison
A second worker computes the real verdict on the replayed trace and compares it to the original failure’s verdict. The case counts as resolved only if the replay is now genuinely
healthy — not merely “didn’t error.”Wiring it into a quality gate
Pass aregressionRunId to the prompt quality gate request to require a minimum resolution rate before a prompt or policy change is allowed to ship. It becomes a normal fourth pass/fail signal alongside your existing gate checks.
Next steps
- Issues — where recurring failures get clustered before they become regression tests
- Evaluations — run and review evaluation results
- Simulations — test prompt changes against a dataset before deploying