

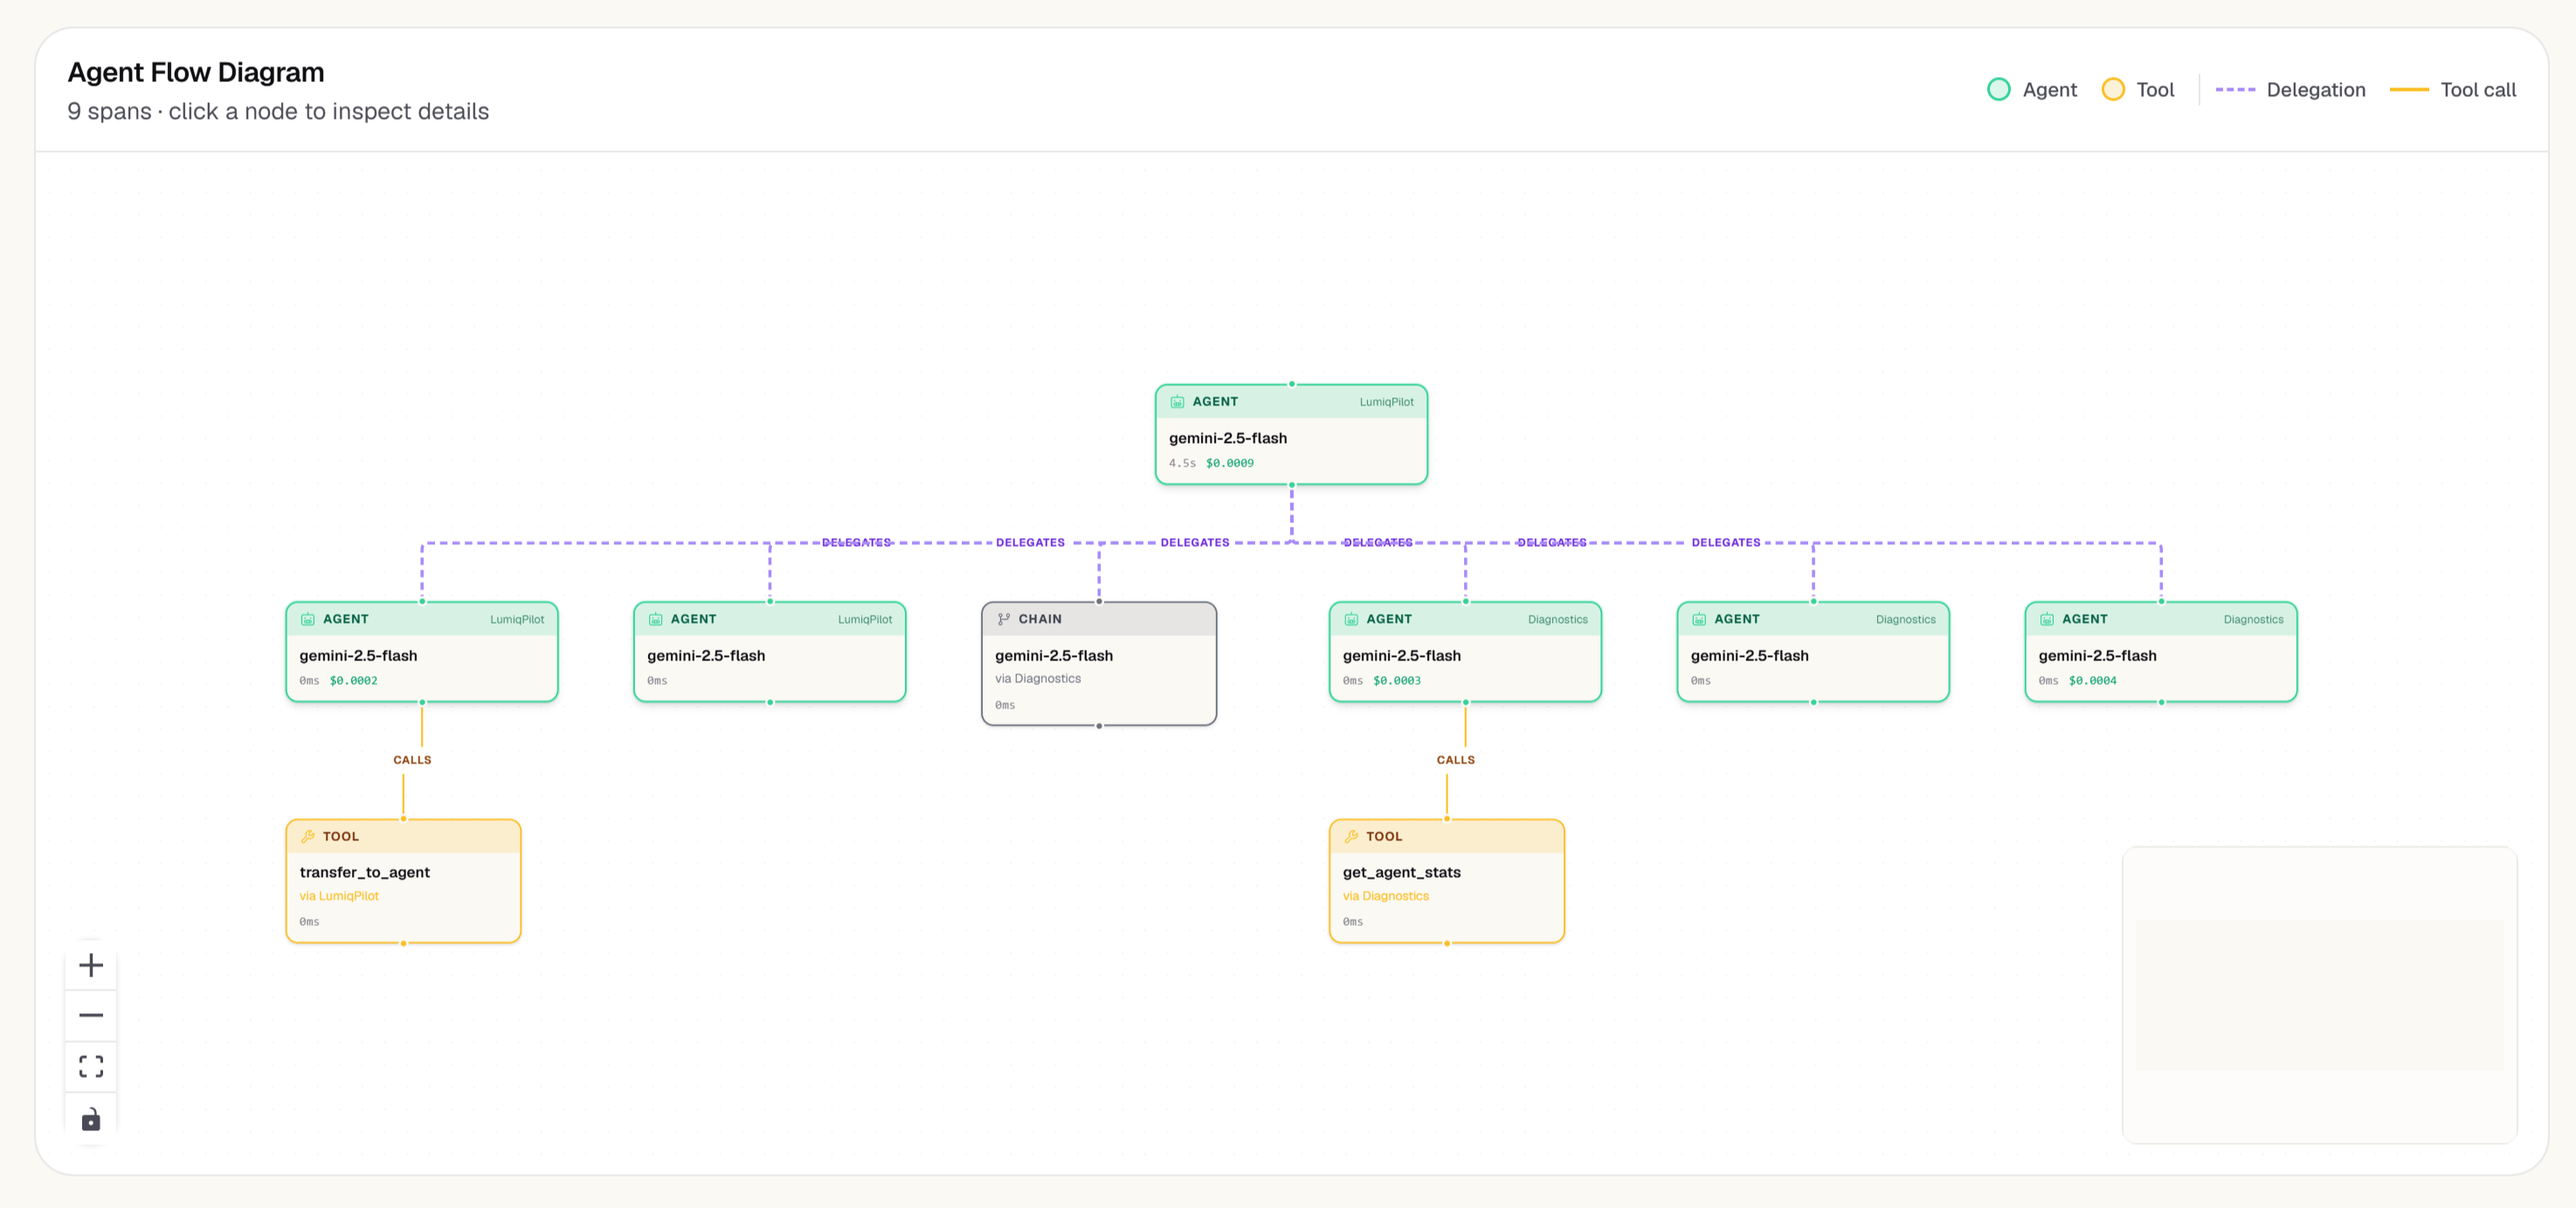
Agent list
The agent list shows all agents with at least one trace in the current date range, sorted by total cost descending by default.
The agents page offers a card view and a table view. Each card or row shows a health score — Health 82 on a card, a letter grade with the score in the table — only when the agent has a real score, meaning it ran in the last 24 hours or at least one measured signal (error rate, cost trend, or evaluation pass rate) backs it. An agent with nothing to base a score on shows no health figure rather than a made-up one. Hover the score to see the signals behind it.
The Error rate sub-line shows the counts behind the percentage, for example “3 of 120 spans”. When an agent has a status (such as Critical) and a health score, the score appears only if it agrees with the status, so you never see “Critical” next to “Health 99”.
At the top of the page, the attention card is a verdict band: it names the agent that most needs attention in one sentence, with See all findings and a Review button for that agent. When every agent is healthy it says so.
Click any agent to open its detail view.
How agent figures are counted
GET /projects/{id}/agents and the agent detail endpoint (GET /projects/{id}/agents/{agentName}) count distinct spans, and they include LLM spans:
- Only agent, tool, and handoff spans reliably carry an agent name. An LLM span inside an agent’s trace that has no agent name of its own is counted toward the most frequent named agent in that trace. Cost, LLM calls, and errors therefore include the model calls the agent made, and the error counts agree with Errors.
total_spans,llm_calls,tool_calls,delegations, anderror_countare distinct spans.error_rateiserror_countdivided bytotal_spans.- An error uses the shared error rule, so a rate-limited or coded failure counts even when its
statusis noterror. tools_usedlists every tool the agent’s spans used, including those on LLM spans that called no tools themselves.- Ranges are trailing windows.
Agent detail
The agent detail view shows metrics for one agent across the selected time range.Cost over time
A time-series chart of total daily cost for this agent. Spikes indicate either increased usage volume or a specific run with abnormally high token consumption — click any spike to see the traces that contributed to it.Latency percentiles
P50, P95, and P99 latency for each day. Increasing P99 with stable P50 indicates occasional outlier runs — usually caused by retries or tool failures.Error breakdown
Errors grouped by type (model error, tool error, timeout, rate limit). The breakdown helps you prioritize: rate limit errors are solved by quota increases or backoff logic; tool errors need debugging in the tool implementation.Failures by layer
The same Failures by layer card as on the Overview, scoped to this agent: where this agent’s analysed failures started, by stack layer. It is absent when none have been analysed or when attributions are not shown to your role.Tool usage
A ranked list of tools this agent called, with total calls, failure count, and average latency per tool. Tools with high failure rates or high latency are the most common causes of poor agent performance.Model usage
All model identifiers used by this agent in the selected period, with token counts and cost attributed per model.Comparing agents
Return to the agent list and use the checkboxes to select 2–4 agents for side-by-side comparison. The comparison view shows cost, latency, and error rate on shared axes for the selected period.Next steps
- Agent Registry — topology view of all agents
- Costs — cost attribution across all dimensions
- Instrumentation — set who gets a failure by layer, starting with the agent’s owner as the fallback