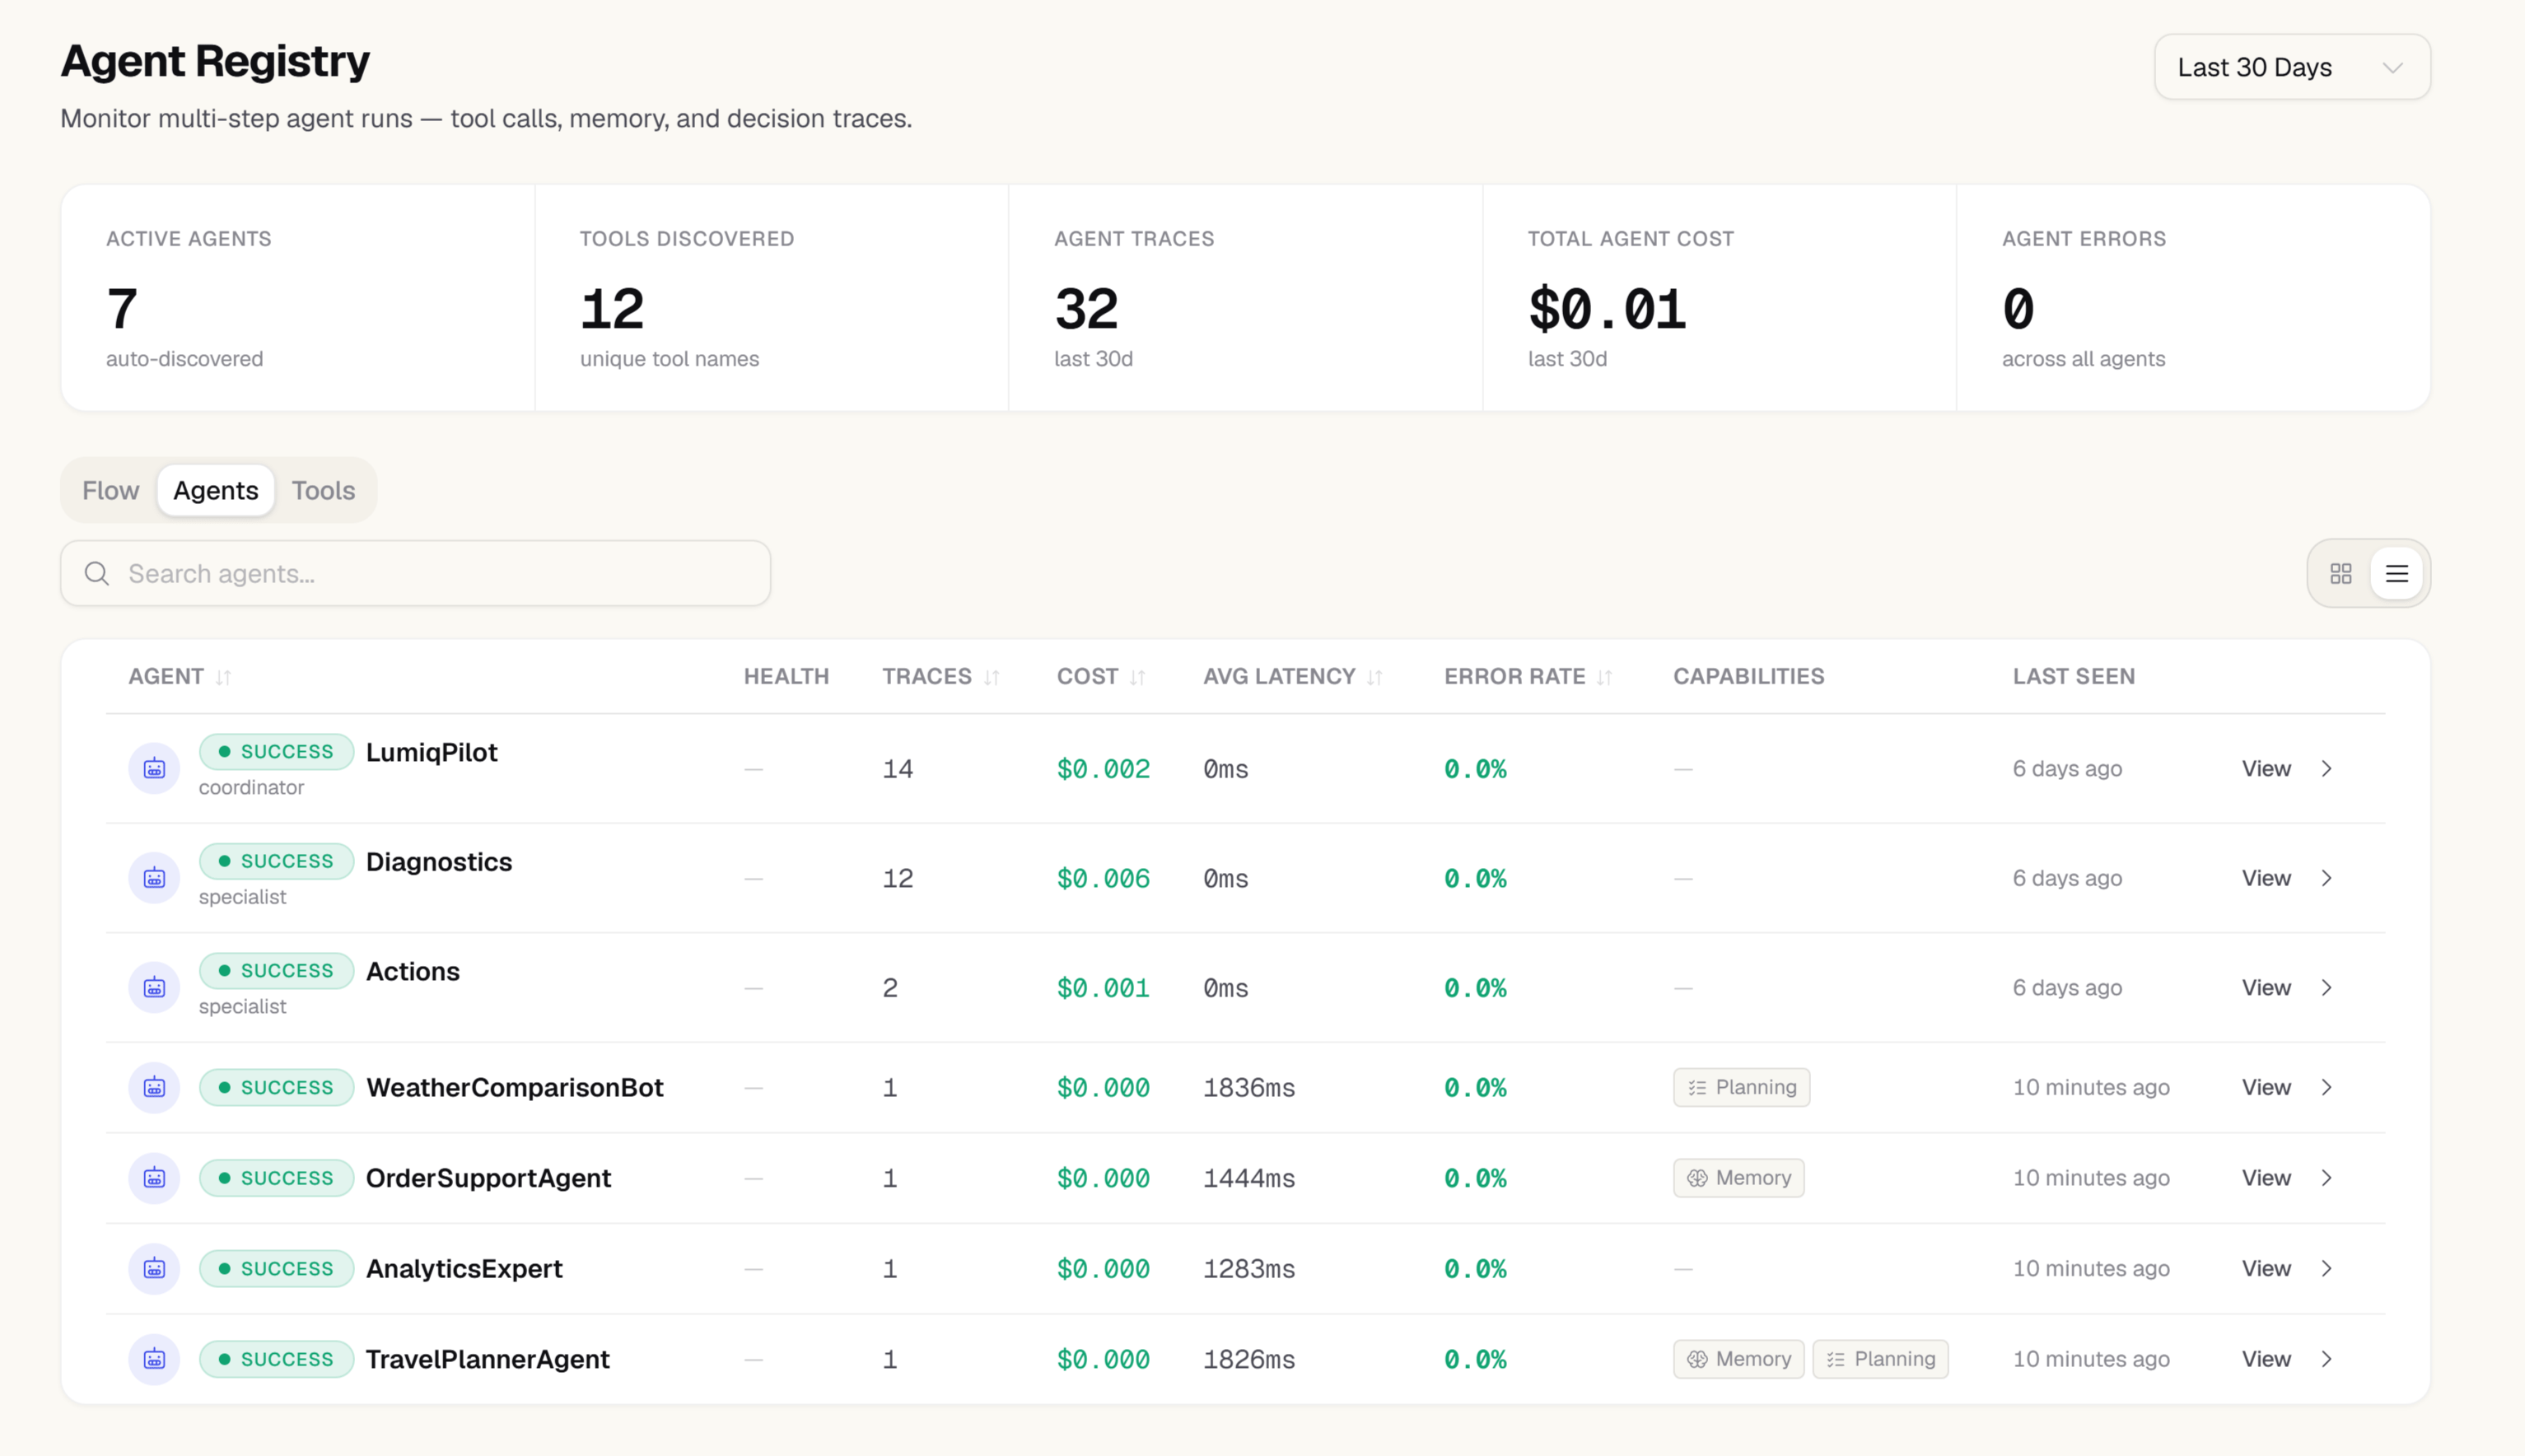
What the registry shows
Each agent entry shows:Agent topology
The topology view renders agents as nodes connected by delegation edges. An edge from Agent A to Agent B means A called B as a sub-agent in at least one trace. Edge thickness scales with delegation frequency. Use the topology to identify:- Coordinator agents that delegate to many specialists
- Agents with unexpectedly high tool diversity (potential scope creep)
- Isolated agents with no connections (standalone tools)
Tool usage
Each agent’s tool panel lists every tool the agent called, with call counts and failure rates. A tool with a failure rate above 10% is highlighted in the reliability column.Filtering
Filter agents by:- Last active — see which agents are actively running vs dormant
- Model — find all agents using a specific model
- Environment — separate production from staging agents
Registering agents in code
Agents appear in the registry automatically when you use the SDK’s agent context:wrapADKAgent() or instrumentADK() — see Google ADK integration.
Compliance history
Both the registry list and an individual agent’s detail page show a compliance badge — pass rate, violation count, and last violation date — pulled from every project in your organization, not just the current one. It’s the same summary that appears next to a delegation line in the trace detail view. This answers a different question than the per-agent performance metrics elsewhere in the registry: not “did this agent’s calls succeed,” but “has this agent — wherever it’s actually run across my org — stayed inside its guardrails.”Compliance data rolls up on a 6-hour cycle. A badge reading “No compliance history yet” means this agent name has no recorded guardrail checks anywhere in your org yet — it isn’t a failing score.
Next steps
- Agents — per-agent performance dashboard
- Traces — drill into individual agent runs
- Guardrails — the policies this compliance history is measured against