

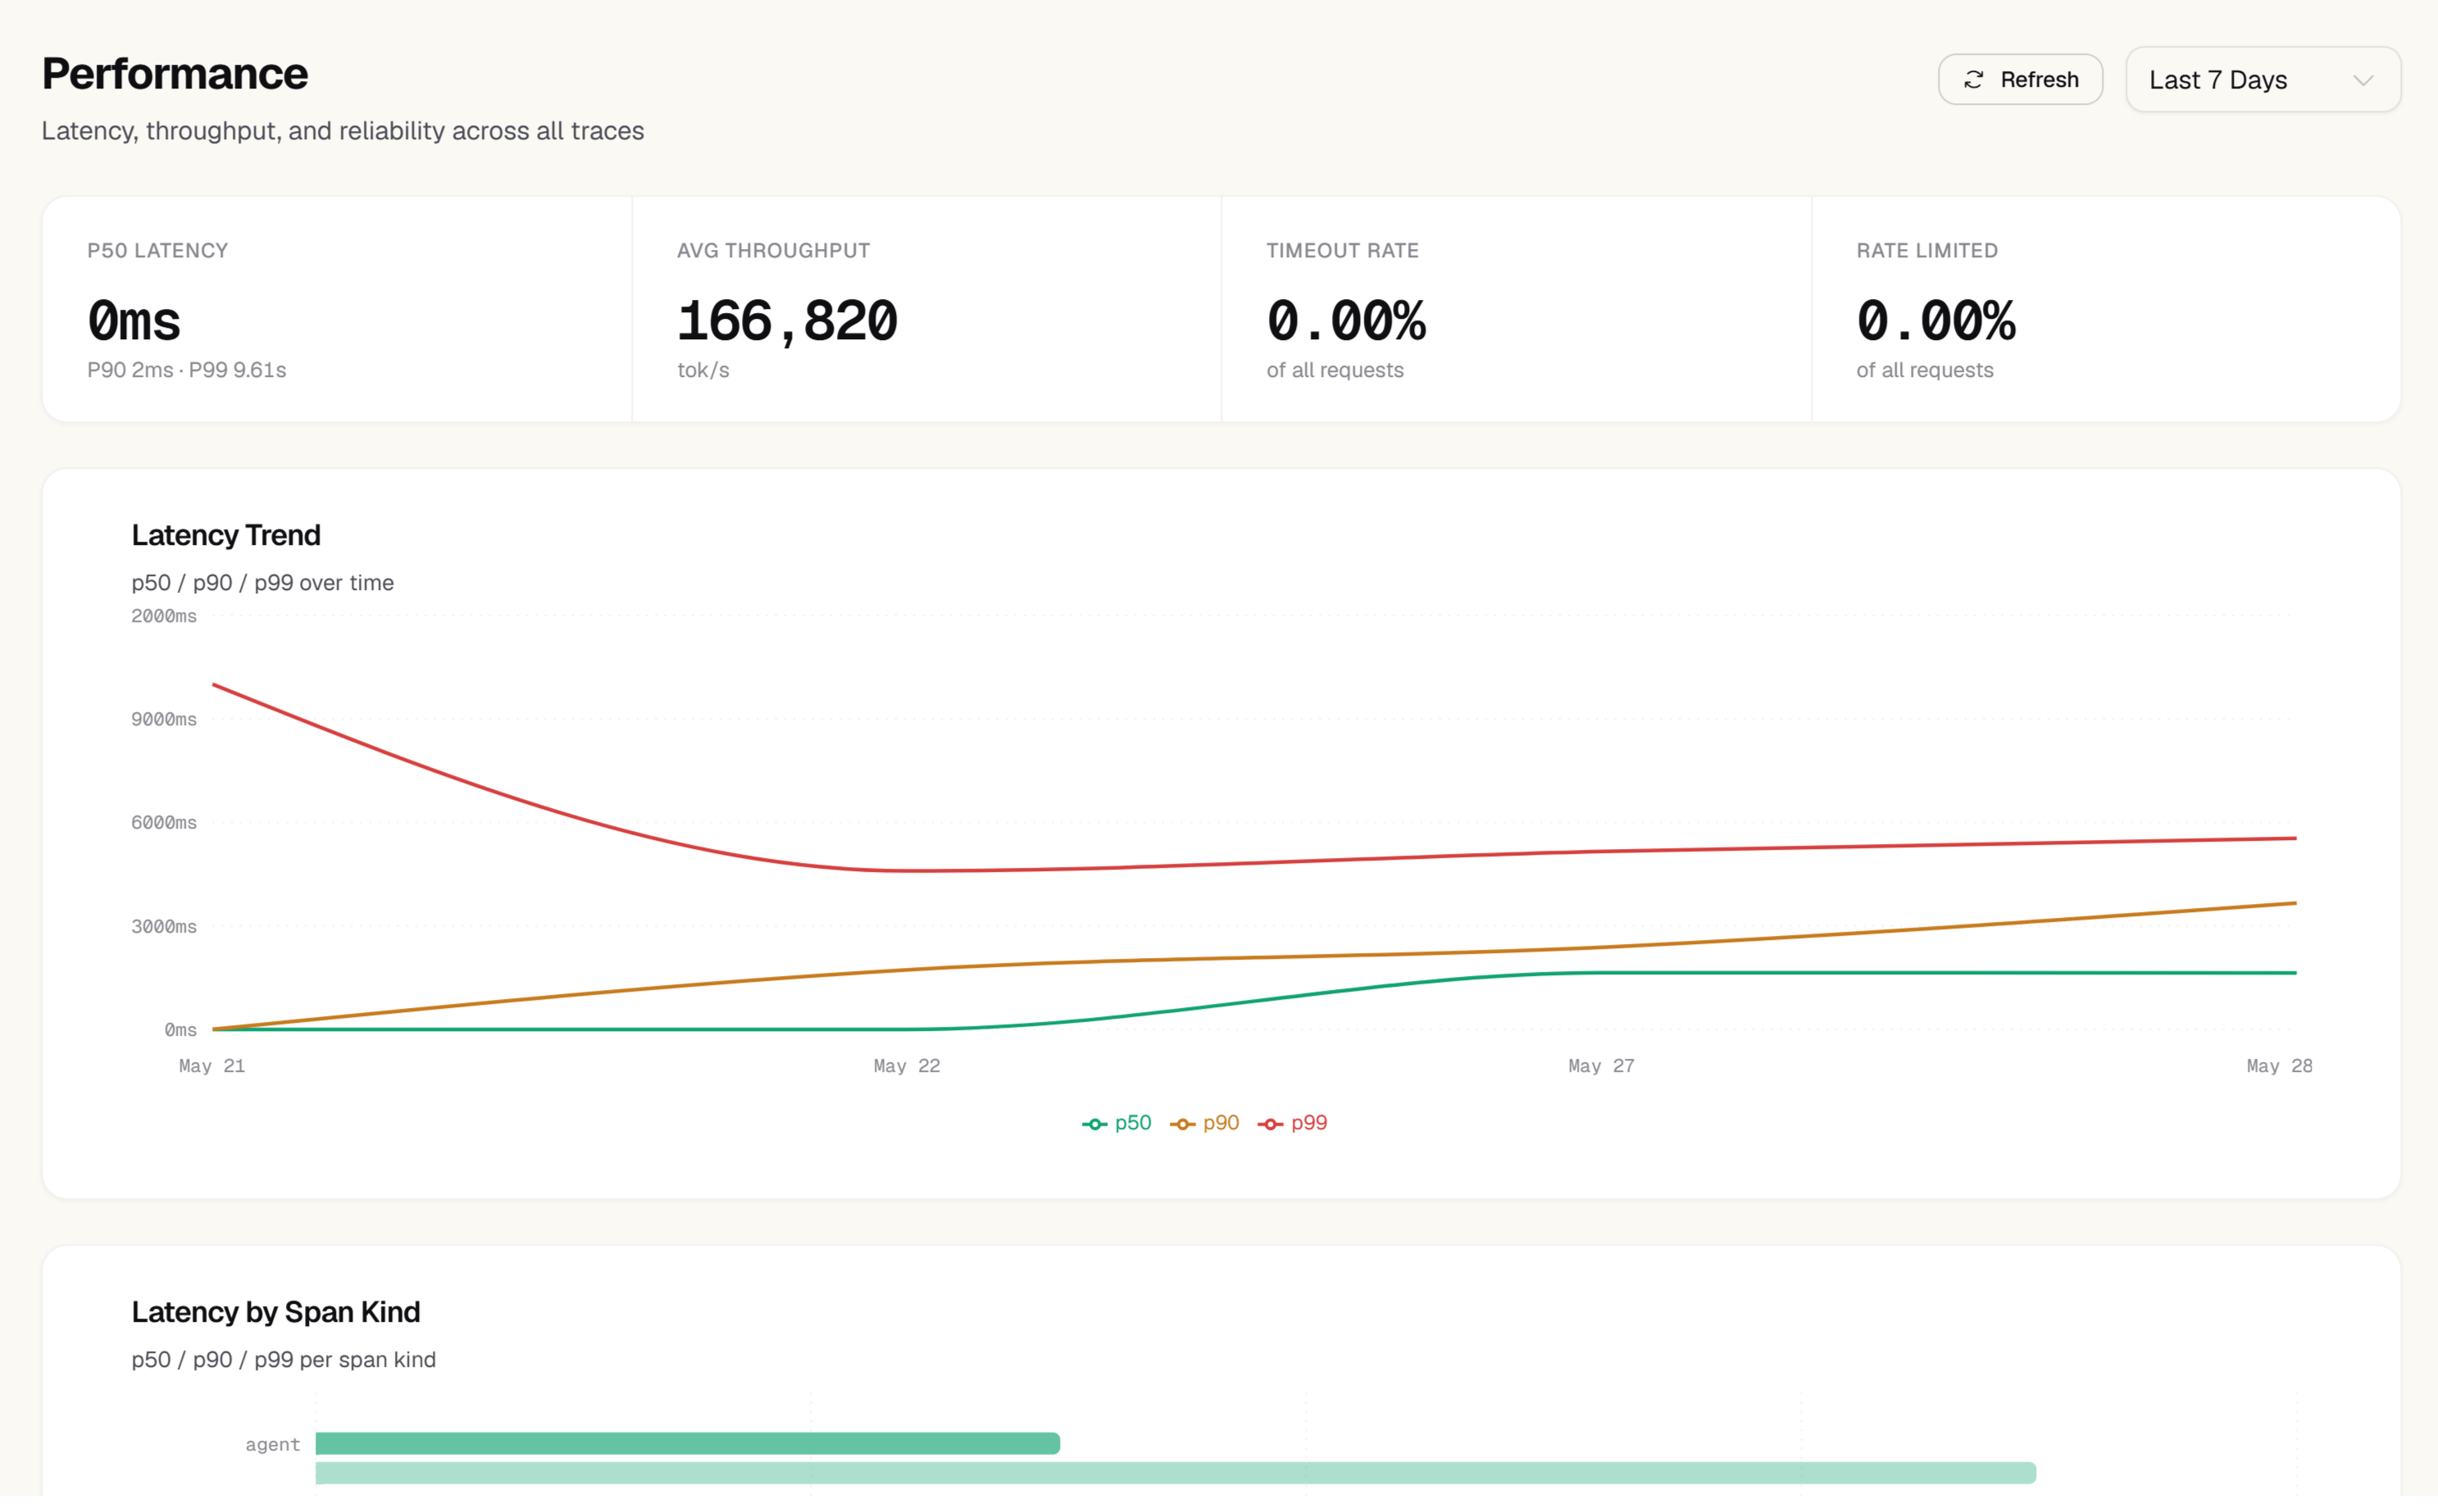
Latency percentiles
The top section of the Performance page shows three percentile cards for the selected time range:P50 (median)
Half of your requests complete faster than this. Represents the typical user experience.
P90
90% of requests complete faster than this. The first signal of performance problems affecting a significant minority of users.
P99
99% of requests complete faster than this. Represents your worst-case latency for regular users. This is the number that wakes people up.
GET /projects/{id}/performance), these three values come back as summary: { p50, p90, p99, count } in milliseconds, computed over every span in the window, with count the number of spans.
Each card shows a trend arrow comparing the current period to the previous equivalent period, so you can see whether tail latency is improving or degrading over time.
Latency distribution histogram
Below the percentile cards, a histogram shows the full distribution of response times for the selected period. The x-axis is latency in milliseconds; the y-axis is the number of requests that fell in each bucket. Use the histogram to understand the shape of your latency distribution:- Tight distribution — most requests take roughly the same time, which means your application is predictable
- Long tail — a small fraction of requests are significantly slower, which may indicate timeouts, retries, or large inputs
- Bimodal distribution — two distinct peaks often indicate two different code paths (e.g., cached vs. uncached requests, or two different models)
Time-to-first-token (TTFT)
For streaming LLM calls, time-to-first-token (TTFT) is often more important to users than total latency — it’s how long they wait before they see any output. The TTFT card shows your P50, P90, and P99 TTFT for streaming requests. TTFT is only available for requests wherestream: true was sent. The SDK captures TTFT automatically for all wrapped streaming calls.
A high TTFT with low total latency suggests the model is spending most of its time on prompt processing before generating output. This is common with large system prompts — consider caching or compressing them.
Latency by model
The By model table ranks all models you’ve used by their P99 latency. For each model you see:
Click any model row to filter the histogram and time-series chart to that model only.
Latency over time
The time-series chart below the table shows how P50, P90, and P99 latency have moved over the selected date range. Toggle individual percentile lines on or off using the legend. Use this chart to:- Correlate latency changes with deployments: changes on your change timeline (a deploy you reported from CI, a prompt version, a config edit) appear as dashed markers on the chart, and the Changes button above it hides or shows them
- See whether tail latency is trending up before it becomes a user-facing issue
- Identify time-of-day patterns (e.g., provider slowdowns during peak hours)
Tokens per second and slow traces
On the API (GET /projects/{id}/performance, ranges 24h, 7d, 30d, 90d, each a trailing window):
tokens_per_secis generation speed: output tokens divided by the call’s latency, averaged over LLM spans that produced output. Input (prompt) tokens are not counted, so the figure is comparable to the speeds model providers quote. It applies to the per-model figures and to the trend over time.slowTraces[].duration_msis wall-clock time, from the start of the trace’s first span to the end of its last span. A trace whose final span is a 34-second timeout reports about 34 seconds, not the gap between span start times.
Throughput
The Throughput section shows requests per minute (RPM) over time. Use this to:- Verify that your application handles traffic peaks without dropping requests
- Correlate throughput changes with latency changes (high throughput often correlates with higher tail latency)
- See your peak traffic periods, which is useful for capacity planning
Filtering
All charts and tables on the Performance page respect the global filter bar:- Date range — select a preset or custom range
- Model — filter to one or more models
- Environment — separate production, staging, and development data
- User ID — drill into performance for a specific user
SLA compliance
The API reportsslaCompliance as the percentage of requests at or under a latency target. Pass target_ms (a positive integer) to set your own target. When you leave it out, the target falls back to 3000 ms and the response says slaCompliance.target_set: false, so a client can tell that the target is a default rather than something you chose.