> ## Documentation Index
> Fetch the complete documentation index at: https://docs.zespan.com/llms.txt
> Use this file to discover all available pages before exploring further.
# ZespanPilot — AI copilot for your LLM operations
> ZespanPilot is an action-first AI copilot that manages alerts, guardrails, prompts, and SDK configuration through natural language conversation, with full audit logging.
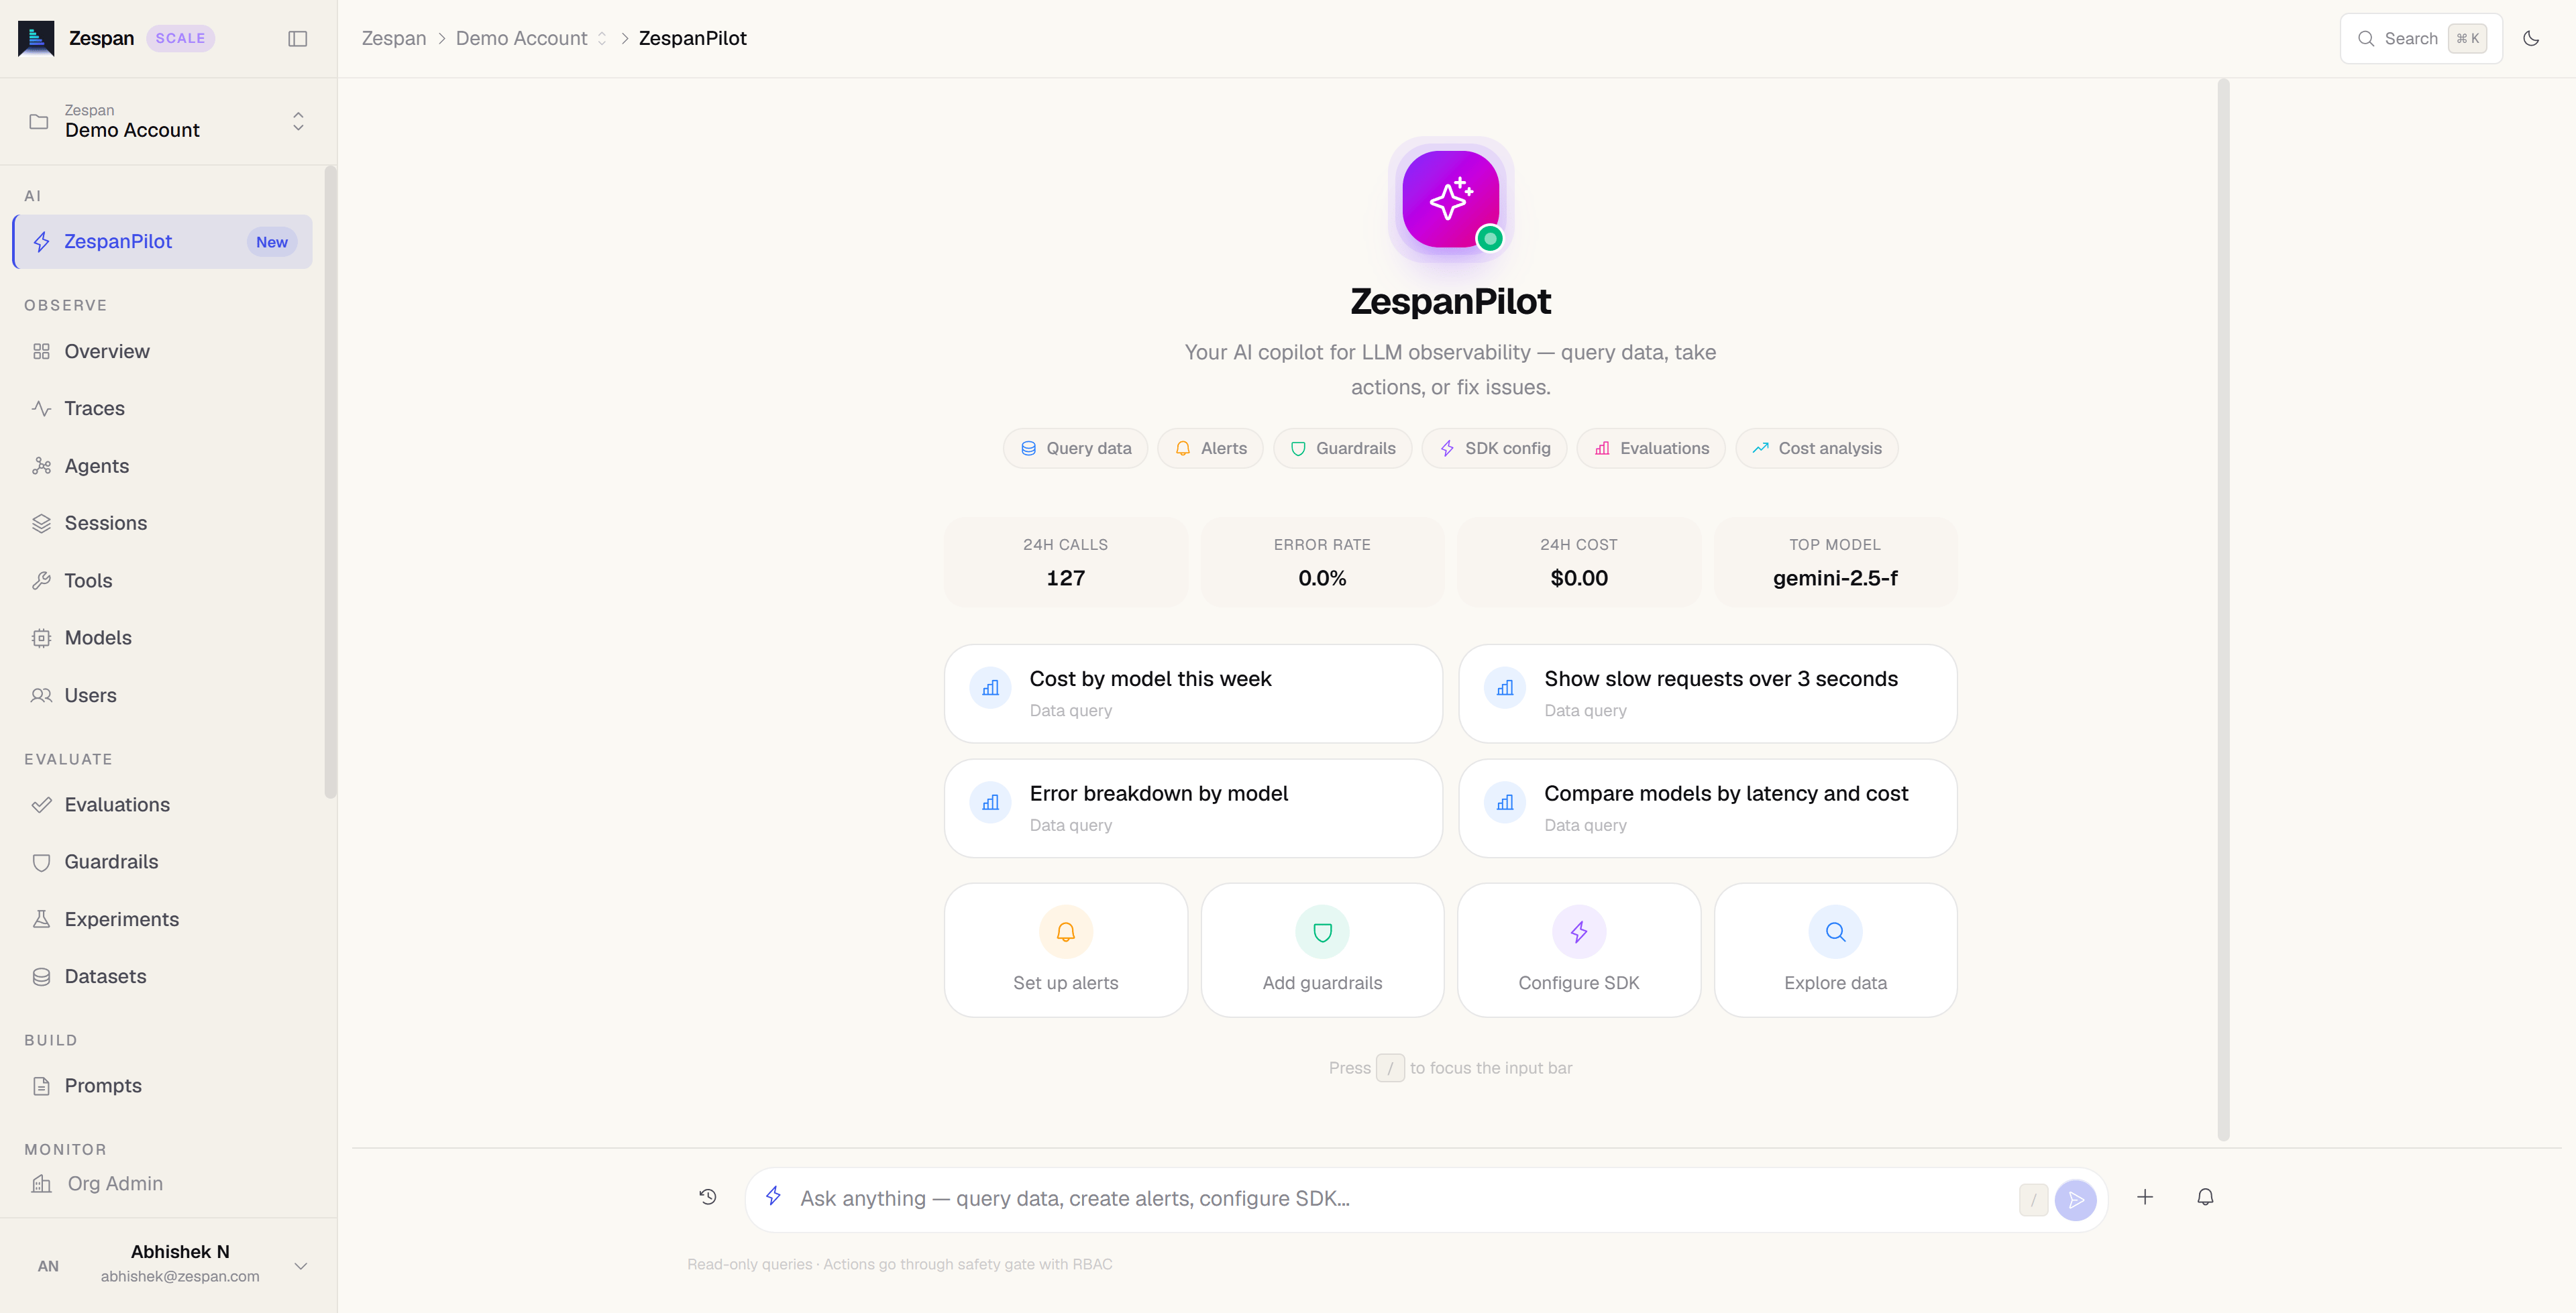 **Jump to the message box:** on the Pilot page, press **⌘K** / **Ctrl+K** (or **/**) to focus the chat input.
ZespanPilot is the AI copilot built into Zespan. Go to **Pilot** in your project to start a conversation. Instead of navigating menus, you describe what you want in plain language — ZespanPilot interprets your intent, shows you exactly what action it plans to take, asks for confirmation on anything consequential, then executes it and reports back.
ZespanPilot is available on the **Pro**, **Team**, and **Scale** plans. On Free and Solo, the **Pilot** sidebar item is visible but opens an upgrade prompt.
## Opening ZespanPilot
* Click **Pilot** in the left sidebar, or go to `/pilot` in your project
* Press **⌘K** / **Ctrl+K** (or **/**) on the Pilot page to jump to the message box
* Click **Ask Pilot** in any anomaly or alert notification banner
Your conversation is preserved while you work: navigating to another page and back returns you to the same conversation with its full transcript, and the **History** panel reopens any earlier conversation in the project with its messages intact. **New conversation** starts a fresh one. Opening Zespan in a new browser tab starts fresh rather than resuming.
## What ZespanPilot can do
ZespanPilot has direct write access to the following resources in your project. It reads context from your live metrics, trace data, and configuration before suggesting or taking action.
Create, modify, snooze, or delete alert rules. "Silence the error-rate alert for the next 2 hours" or "Create a new alert if p99 latency exceeds 5 seconds."
Enable, disable, or update guardrail policies. "Disable the toxicity guardrail on the demo project" or "Add a new guardrail that blocks requests about competitors."
Create new prompt versions, update labels, and roll back to previous versions. "Roll back the support-reply prompt to the previous production version."
Push real-time configuration changes to running SDK instances. "Switch all GPT-4o calls to GPT-4o-mini" or "Set the sample rate to 10% for one hour."
Explain cost spikes, surface top-spending models, and generate optimization recommendations on demand.
Correlate anomalies, trace errors, and configuration changes into a coherent timeline with a plain-English explanation.
Investigate a recurring Issue across its sample traces, not one at a time. "Investigate the rate limit issue" reports whether the occurrences share one root cause or are several different failure modes that happen to share the same verdict, operation, and error code — and says so plainly when an Issue is mixing more than one problem.
Create an evaluator by describing what you want scored. "Create an evaluator that checks whether replies stay on topic" picks the right built-in metric and creates the definition; follow up with "run it on last week's traces."
## Safety gates
ZespanPilot applies two levels of safety before executing any write action:
**Role check.** Members with the **Member** role cannot trigger any write action. Admins can execute most actions. Owners have unrestricted access. If your role is insufficient, Pilot explains what permission is needed and who to contact.
**Confirmation for high-risk actions.** For destructive or broadly impactful operations — deleting an alert rule, disabling guardrails, changing model routing, setting `disable_tracing: true` — Pilot presents a confirmation card before executing. The card shows exactly what will change and gives you a **Confirm** or **Cancel** button. Pilot never takes a high-risk action without explicit confirmation.
Actions confirmed in ZespanPilot take effect immediately. There is no undo button — but every action is logged in the audit trail (see below), and most changes can be reversed by asking Pilot to undo them.
## Example conversations
The following examples show the kinds of requests ZespanPilot handles well:
**You:** Why did my costs spike this morning?
**Pilot:** I can see a 340% cost increase between 9:00 AM and 10:30 AM today. The spike is concentrated in the `gpt-4o` model — 847 requests were made in that window compared to your 7-day average of 210. The largest trace was from session `sess_abc123`, which made 14 sequential GPT-4o calls with an average of 3,200 input tokens each. That session alone cost \$0.47. The spike correlates with a deployment at 8:52 AM — it looks like a new feature is making more LLM calls than expected.
**You:** Create an alert if hourly GPT-4o cost exceeds \$5.
**Pilot:** I'll create an alert rule with metric `cost_usd`, condition `>`, threshold `5.00`, window `60 minutes`, model filter `gpt-4o`. Does that look right?
**You:** Yes
**Pilot:** Alert rule "GPT-4o hourly cost > \$5" created. It will be evaluated in the next 5-minute cycle.
**You:** GPT-4o is down. Switch all calls to GPT-4o-mini immediately.
**Pilot:** I'll push an SDK config rule to redirect all `gpt-4o` calls to `gpt-4o-mini` across all running instances. This is a high-risk operation — it affects all active API key holders for this project. Confirm?
**You:** Confirm
**Pilot:** Config rule applied (version 12). Running SDK instances will pick up the change within the next flush cycle (\~2 seconds). I'll create a reminder to remove this rule — how long should the override stay active?
**You:** 1 hour
**Pilot:** Done. I've set the rule to expire in 60 minutes. You'll receive a notification when it's removed.
**You:** The support-reply prompt is producing bad responses. Roll it back to the last stable version.
**Pilot:** The current production version of `support-reply` is v8 (deployed 2 hours ago). The previous production version was v7. I'll move the `production` label from v8 back to v7. Confirm?
**You:** Yes
**Pilot:** Label updated. `support-reply` version 7 is now live on production. Version 8 still exists in staging if you want to review and fix it.
## Audit log
Every action ZespanPilot takes is written to the audit log with full attribution. To review the log, go to **Settings → Audit Log**. Each entry shows:
* The timestamp of the action
* The user who triggered it
* The action type (e.g., `alert.create`, `sdk_config.update`, `prompt.label_update`)
* The before and after state (for updates)
* Whether the action required and received confirmation
The audit log is exportable as CSV from the Scale plan. Use it to meet compliance requirements or to give engineering managers a review of what changed and when.
## Self-tracing
ZespanPilot traces its own AI calls through Zespan. You can see Pilot's model calls in your traces view under the `zespanpilot` agent tag. This means Pilot's own token usage and latency count against your event quota — but it also means you have full transparency into how Pilot is using AI to serve your requests.
## Notifications from Pilot
ZespanPilot can proactively surface information without you asking. When an anomaly is detected or a new cost optimization opportunity is found, a notification badge appears on the Pilot icon in the sidebar. Open Pilot to see the full context and take action.
**Jump to the message box:** on the Pilot page, press **⌘K** / **Ctrl+K** (or **/**) to focus the chat input.
ZespanPilot is the AI copilot built into Zespan. Go to **Pilot** in your project to start a conversation. Instead of navigating menus, you describe what you want in plain language — ZespanPilot interprets your intent, shows you exactly what action it plans to take, asks for confirmation on anything consequential, then executes it and reports back.
ZespanPilot is available on the **Pro**, **Team**, and **Scale** plans. On Free and Solo, the **Pilot** sidebar item is visible but opens an upgrade prompt.
## Opening ZespanPilot
* Click **Pilot** in the left sidebar, or go to `/pilot` in your project
* Press **⌘K** / **Ctrl+K** (or **/**) on the Pilot page to jump to the message box
* Click **Ask Pilot** in any anomaly or alert notification banner
Your conversation is preserved while you work: navigating to another page and back returns you to the same conversation with its full transcript, and the **History** panel reopens any earlier conversation in the project with its messages intact. **New conversation** starts a fresh one. Opening Zespan in a new browser tab starts fresh rather than resuming.
## What ZespanPilot can do
ZespanPilot has direct write access to the following resources in your project. It reads context from your live metrics, trace data, and configuration before suggesting or taking action.
Create, modify, snooze, or delete alert rules. "Silence the error-rate alert for the next 2 hours" or "Create a new alert if p99 latency exceeds 5 seconds."
Enable, disable, or update guardrail policies. "Disable the toxicity guardrail on the demo project" or "Add a new guardrail that blocks requests about competitors."
Create new prompt versions, update labels, and roll back to previous versions. "Roll back the support-reply prompt to the previous production version."
Push real-time configuration changes to running SDK instances. "Switch all GPT-4o calls to GPT-4o-mini" or "Set the sample rate to 10% for one hour."
Explain cost spikes, surface top-spending models, and generate optimization recommendations on demand.
Correlate anomalies, trace errors, and configuration changes into a coherent timeline with a plain-English explanation.
Investigate a recurring Issue across its sample traces, not one at a time. "Investigate the rate limit issue" reports whether the occurrences share one root cause or are several different failure modes that happen to share the same verdict, operation, and error code — and says so plainly when an Issue is mixing more than one problem.
Create an evaluator by describing what you want scored. "Create an evaluator that checks whether replies stay on topic" picks the right built-in metric and creates the definition; follow up with "run it on last week's traces."
## Safety gates
ZespanPilot applies two levels of safety before executing any write action:
**Role check.** Members with the **Member** role cannot trigger any write action. Admins can execute most actions. Owners have unrestricted access. If your role is insufficient, Pilot explains what permission is needed and who to contact.
**Confirmation for high-risk actions.** For destructive or broadly impactful operations — deleting an alert rule, disabling guardrails, changing model routing, setting `disable_tracing: true` — Pilot presents a confirmation card before executing. The card shows exactly what will change and gives you a **Confirm** or **Cancel** button. Pilot never takes a high-risk action without explicit confirmation.
Actions confirmed in ZespanPilot take effect immediately. There is no undo button — but every action is logged in the audit trail (see below), and most changes can be reversed by asking Pilot to undo them.
## Example conversations
The following examples show the kinds of requests ZespanPilot handles well:
**You:** Why did my costs spike this morning?
**Pilot:** I can see a 340% cost increase between 9:00 AM and 10:30 AM today. The spike is concentrated in the `gpt-4o` model — 847 requests were made in that window compared to your 7-day average of 210. The largest trace was from session `sess_abc123`, which made 14 sequential GPT-4o calls with an average of 3,200 input tokens each. That session alone cost \$0.47. The spike correlates with a deployment at 8:52 AM — it looks like a new feature is making more LLM calls than expected.
**You:** Create an alert if hourly GPT-4o cost exceeds \$5.
**Pilot:** I'll create an alert rule with metric `cost_usd`, condition `>`, threshold `5.00`, window `60 minutes`, model filter `gpt-4o`. Does that look right?
**You:** Yes
**Pilot:** Alert rule "GPT-4o hourly cost > \$5" created. It will be evaluated in the next 5-minute cycle.
**You:** GPT-4o is down. Switch all calls to GPT-4o-mini immediately.
**Pilot:** I'll push an SDK config rule to redirect all `gpt-4o` calls to `gpt-4o-mini` across all running instances. This is a high-risk operation — it affects all active API key holders for this project. Confirm?
**You:** Confirm
**Pilot:** Config rule applied (version 12). Running SDK instances will pick up the change within the next flush cycle (\~2 seconds). I'll create a reminder to remove this rule — how long should the override stay active?
**You:** 1 hour
**Pilot:** Done. I've set the rule to expire in 60 minutes. You'll receive a notification when it's removed.
**You:** The support-reply prompt is producing bad responses. Roll it back to the last stable version.
**Pilot:** The current production version of `support-reply` is v8 (deployed 2 hours ago). The previous production version was v7. I'll move the `production` label from v8 back to v7. Confirm?
**You:** Yes
**Pilot:** Label updated. `support-reply` version 7 is now live on production. Version 8 still exists in staging if you want to review and fix it.
## Audit log
Every action ZespanPilot takes is written to the audit log with full attribution. To review the log, go to **Settings → Audit Log**. Each entry shows:
* The timestamp of the action
* The user who triggered it
* The action type (e.g., `alert.create`, `sdk_config.update`, `prompt.label_update`)
* The before and after state (for updates)
* Whether the action required and received confirmation
The audit log is exportable as CSV from the Scale plan. Use it to meet compliance requirements or to give engineering managers a review of what changed and when.
## Self-tracing
ZespanPilot traces its own AI calls through Zespan. You can see Pilot's model calls in your traces view under the `zespanpilot` agent tag. This means Pilot's own token usage and latency count against your event quota — but it also means you have full transparency into how Pilot is using AI to serve your requests.
## Notifications from Pilot
ZespanPilot can proactively surface information without you asking. When an anomaly is detected or a new cost optimization opportunity is found, a notification badge appears on the Pilot icon in the sidebar. Open Pilot to see the full context and take action.