> ## Documentation Index
> Fetch the complete documentation index at: https://docs.zespan.com/llms.txt
> Use this file to discover all available pages before exploring further.
# Traces — inspect every agent run and its steps
> Browse your full agent run log, filter by model or status, and drill into any run: a plain-English health verdict, three evaluation lenses, a span navigator + inspector, and flow and flame graphs of every agent turn, tool call, and LLM interaction.
The Traces section gives you two complementary views of your agent traffic: a paginated log of every agent run your application has executed, and a detail view that opens any individual run into a plain-English health verdict, three evaluation lenses, and a resizable span navigator + inspector — plus flow and flame visualizations of the run's structure. Together they let you move from a high-level question like "why did my agent costs spike this afternoon?" down to the exact tool call or LLM interaction that caused it.
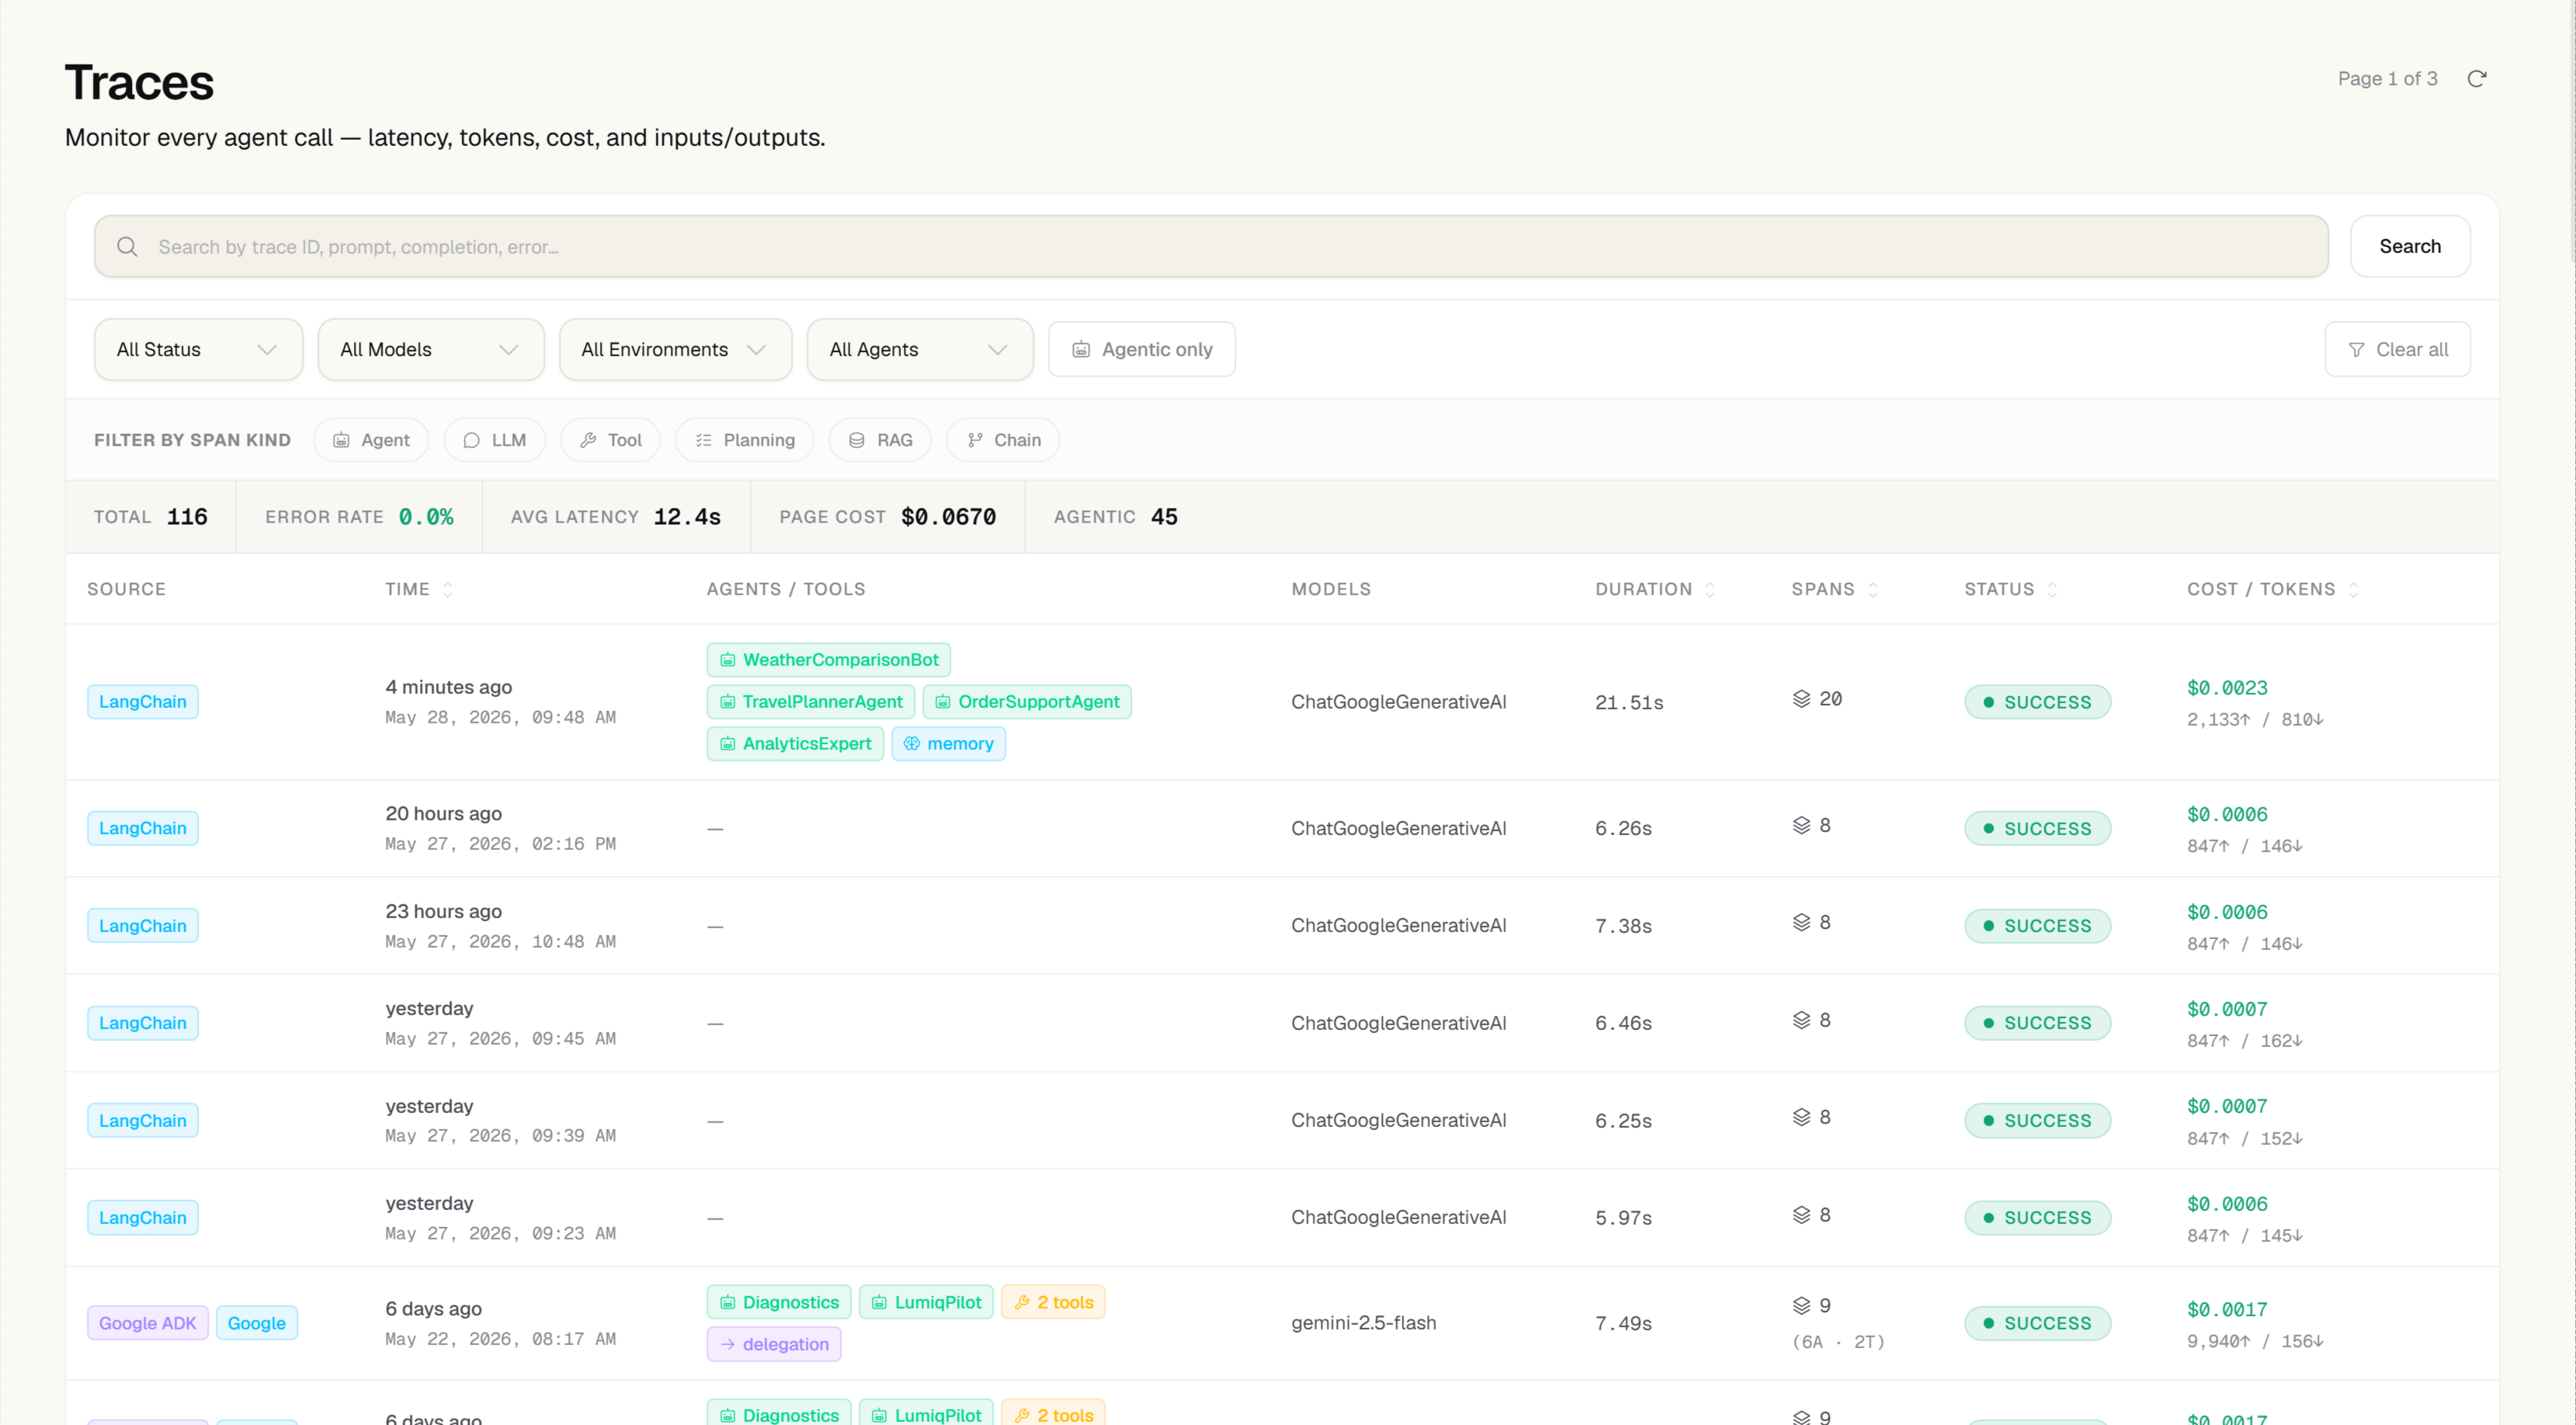 ## Requests log
The requests log shows all spans recorded for your project. Each row represents a single operation and shows:
| Column | What it shows |
| --------- | ---------------------------------------------------------------------- |
| Timestamp | When the operation ran, in your local timezone |
| Model | The model identifier (e.g. `gpt-4o`, `claude-sonnet-4-6`) |
| Status | Outcome: `success`, `error`, `timeout`, `rate_limited`, or `cancelled` |
| Latency | Total duration in milliseconds |
| Cost | USD cost from token counts and model pricing |
| Tokens | Input and output token counts |
### Filtering
The filter bar lets you narrow the list by model, status, date range, environment, and user ID. Filters combine freely and the table updates immediately.
### Pagination
The table uses cursor-based pagination returning up to 200 events per page. Cursor pagination ensures consistent results even if new agent events arrive while you are browsing.
### Opening a trace
Click any row to open the trace detail view — the redesigned layout described below. If the operation is part of a multi-span agent run, every span is available in the span navigator and the flow/flame visualizations: agent turns, tool calls, retrieval steps, and every LLM interaction.
***
## Trace detail
The trace detail view opens top-down from a one-line judgment to the exact span that caused it.
### Verdict
At the top, a **verdict banner** states in plain English whether the run was **Healthy**, **Degraded**, **Failed**, or **Running** — with a headline that names what happened ("Trace failed — `check_refund_eligibility` timed out on all 3 attempts") and a short summary. It's computed instantly and deterministically from the run's spans, statuses, latencies, and eval results — the *same* classifier that powers verdict-based [Issue clustering](/dashboard/issues), so a trace and its Issue always agree.
* **Jump to broken step** takes you straight to the span the verdict blames (the deepest failing span, or the slowest tool on a degraded run).
* **Explain** generates an LLM narrative on demand — see [Root cause](#root-cause) below. The instant verdict is free; the LLM narrative runs only when you ask.
Below the verdict, a **metrics** row (duration, cost, spans, tokens with a cached/reasoning breakdown) and a **status breakdown** (counts of success / error / timeout / rate-limited / cancelled) summarize the run at a glance.
### The three lenses
A trace can pass its final-answer check and still be unhealthy underneath. The **lenses** panel grades the same run at three altitudes, from your evaluation scores:
* **Final response** (black-box) — was the output itself good?
* **Trajectory** (glass-box) — was the *sequence of steps* right?
* **Per step** (white-box) — was each individual call correct?
Each shows pass / fail / N-A with a one-line reason. When they disagree — a passing final answer over a broken trajectory — that gap is the signal only agent tracing catches. Clicking a lens jumps the inspector to the relevant span or the Evaluators tab.
### Span navigator
The left pane lists every span in the run. Two layouts, toggled at the top:
* **Waterfall** — spans on a shared timeline with duration bars, so you see where wall-clock time went.
* **Tree** — the call hierarchy, so you see who called whom.
Each row shows the span's kind (a colored icon + label), name, agent, cost, tokens, and its start offset from the trace start (e.g. `+1.24s`). Above the tree:
* **Kind pills** — one per span kind present (LLM, Tool, Agent, Plan, RAG, …), each with a count; click to filter to that kind.
* **All / Errors / Critical path** — the critical-path filter shows only the ancestors and descendants of the failing (or slowest) span.
* **Search** — filter by name, agent, or kind.
The tree is fully keyboard-navigable (arrow keys to move, expand/collapse, Enter to select), and cross-service traces render service badges, transport labels, and a continuation node for a subtree whose upstream parent wasn't ingested here.
### Inspector
The right pane is a resizable inspector. With no span selected it shows **trace-overview** tabs; click a span (or a navigator row) and it becomes that span's detail.
Trace-overview tabs:
| Tab | What it shows |
| -------------- | ---------------------------------------------------------------------------------------------------------------------------------------- |
| **I/O** | The trace's input and final output, a token breakdown (input / cached / output / reasoning), and where wall-clock time went by span kind |
| **Flow** | The agent/tool call graph — see [Flow diagram](#flow-diagram) |
| **Flame** | Span durations on a timeline — see [Flame graph](#flame-graph) |
| **Evaluators** | Every evaluator score on the run, with threshold, verdict, judge model, and reasoning |
| **Agents** | Per-agent rollup (spans, tokens, cost, latency, tools, delegate/delegated role) and the delegation chain |
| **Root cause** | AI root-cause analysis, on runs that failed — see [Root cause](#root-cause) |
| **Retrieval** | Retrieved RAG chunks and per-retrieval-span context counts, when the run did retrieval — see [Retrieval](#retrieval) |
| **A2A** | Agent-to-Agent task lifecycle (task/context IDs, state, and the transition history), when present |
| **Log stream** | The run as a flat, timestamped start/end event log |
| **Metadata** | Trace ID, environment, user/session, tags, and the raw metadata object |
| **Session** | The conversation this trace belongs to — see [Session context](#session-context) |
Per-span detail shows the span's **identity** (its own ID and parent ID, with copy buttons and a **copy-link-to-span** permalink), an I/O tab (prompt, system prompt, completion, tool args/result, decision rationale, RAG chunks, and image/video generation fields), a Metadata tab, and an Evaluators tab when scores target that span.
The span permalink writes a `?span=` deep link. Open it and the trace loads with that exact span selected — handy for pasting a specific step into a support ticket or incident doc.
### Flow diagram
The **Flow** tab draws the run as a node graph — one node per span, connected by its call structure — with two layouts you toggle: **Hierarchical** (who called whom) and **Chronological** (positioned by wall-clock start). Edges are labeled by kind (delegation, tool call, infers) and colored, failed steps stand out, and each node carries an execution-order badge. Pan and zoom with the mouse, fit-to-width, lock panning, or open **full screen**. Click a node to inspect that span.
### Flame graph
The **Flame** tab shows span durations as stacked bars, one row per depth level, in two modes: **Chronological** (bars positioned by wall-clock time — gaps are real idle time) and **Hierarchical** (each parent's width divided among its children by duration share — fully packed, so structure reads cleanly on a mostly-idle run). Bars are colored by span kind, with a legend that reflects the kinds actually present. Open it **full screen** for a taller view. Click a bar to inspect that span.
### Retrieval
For a RAG run, the **Retrieval** tab surfaces the retrieved documents — chunk text, document/chunk IDs, source, and relevance score — and a per-retrieval-span context count. Retrieval is captured automatically by the LangChain and LlamaIndex integrations, or explicitly for manual RAG via [`recordRetrieval()` / `record_retrieval()`](/sdk/manual-spans#recording-retrieved-documents). This is the same context the [RAG evaluators](/dashboard/evaluations#evaluating-rag-pipelines) score.
### Session context
When a trace belongs to a session (an SDK-supplied `session_id`), the **Session** tab shows the whole conversation: a rollup (user, turn count, total duration and cost) and every sibling trace in the session — the current one highlighted — each linking to its own trace. Traces without a session don't show the tab.
### Guardrail violations in the trace
When a guardrail check blocks, warns, or redacts something during a run, the violation appears as its own span in the navigator and the flow/flame views — positioned as a child of the span it evaluated, colored to match the guardrail outcome, right alongside the tool call and LLM spans instead of in a separate log you have to cross-reference.
Select the guardrail span to see which policy fired, the check phase (pre or post), and the exact value that triggered it. From there, click **Promote to Policy** to turn that one violation into a permanent guardrail rule — the tool, field, and value are pre-filled from the violation itself. See [Promoting a violation to a policy](/dashboard/guardrails#promoting-a-violation-to-a-policy).
### Delegation compliance
When a span shows `Delegated from `, a compact badge next to the agent's name (in the Agents tab and on the flow graph) summarizes that agent's guardrail-compliance history: pass rate, violation count, and its most recent violation. This is pulled from **anywhere in your organization** — every project, not just the current one — so you can see at the moment of a handoff whether the agent you're about to trust has a clean record elsewhere in your org.
| Badge | Meaning |
| --------------------------- | --------------------------------------------------------------------- |
| Green, `≥95% pass` | Reliable track record |
| Yellow, `80–94% pass` | Some recent violations — worth a look |
| Red, `<80% pass` | Frequent violations |
| "No compliance history yet" | This agent name has no recorded guardrail checks anywhere in your org |
The same badge appears on that agent's own page in the [Agent Registry](/dashboard/agent-registry#compliance-history).
### Root cause
AI root cause analysis requires the Pro plan or higher.
Click **Explain** on the verdict banner, or open the **Root cause** tab, to run an AI root-cause analysis on the full agent trace. Zespan examines all spans — timing, errors, token counts, tool call results, and agent delegation chains — and returns:
* A plain-English summary of the entire agent run
* The identified root cause type (e.g. `tool_failure`, `token_limit_exceeded`, `agent_loop`)
* The specific problem span, and — for a multi-agent run — the **causal agent**: which upstream agent's output poisoned the downstream failure, and at which handoff step
* Contributing factors across the trace
* Step-by-step fix recommendations with implementation notes
* A prevention tip
Analysis takes 5–30 seconds and results are cached for 48 hours.
If a trace has no errors but latency is unexpectedly high, root cause analysis can still help — it identifies slow spans and suggests optimizations even when every span shows a success status.
## Requests log
The requests log shows all spans recorded for your project. Each row represents a single operation and shows:
| Column | What it shows |
| --------- | ---------------------------------------------------------------------- |
| Timestamp | When the operation ran, in your local timezone |
| Model | The model identifier (e.g. `gpt-4o`, `claude-sonnet-4-6`) |
| Status | Outcome: `success`, `error`, `timeout`, `rate_limited`, or `cancelled` |
| Latency | Total duration in milliseconds |
| Cost | USD cost from token counts and model pricing |
| Tokens | Input and output token counts |
### Filtering
The filter bar lets you narrow the list by model, status, date range, environment, and user ID. Filters combine freely and the table updates immediately.
### Pagination
The table uses cursor-based pagination returning up to 200 events per page. Cursor pagination ensures consistent results even if new agent events arrive while you are browsing.
### Opening a trace
Click any row to open the trace detail view — the redesigned layout described below. If the operation is part of a multi-span agent run, every span is available in the span navigator and the flow/flame visualizations: agent turns, tool calls, retrieval steps, and every LLM interaction.
***
## Trace detail
The trace detail view opens top-down from a one-line judgment to the exact span that caused it.
### Verdict
At the top, a **verdict banner** states in plain English whether the run was **Healthy**, **Degraded**, **Failed**, or **Running** — with a headline that names what happened ("Trace failed — `check_refund_eligibility` timed out on all 3 attempts") and a short summary. It's computed instantly and deterministically from the run's spans, statuses, latencies, and eval results — the *same* classifier that powers verdict-based [Issue clustering](/dashboard/issues), so a trace and its Issue always agree.
* **Jump to broken step** takes you straight to the span the verdict blames (the deepest failing span, or the slowest tool on a degraded run).
* **Explain** generates an LLM narrative on demand — see [Root cause](#root-cause) below. The instant verdict is free; the LLM narrative runs only when you ask.
Below the verdict, a **metrics** row (duration, cost, spans, tokens with a cached/reasoning breakdown) and a **status breakdown** (counts of success / error / timeout / rate-limited / cancelled) summarize the run at a glance.
### The three lenses
A trace can pass its final-answer check and still be unhealthy underneath. The **lenses** panel grades the same run at three altitudes, from your evaluation scores:
* **Final response** (black-box) — was the output itself good?
* **Trajectory** (glass-box) — was the *sequence of steps* right?
* **Per step** (white-box) — was each individual call correct?
Each shows pass / fail / N-A with a one-line reason. When they disagree — a passing final answer over a broken trajectory — that gap is the signal only agent tracing catches. Clicking a lens jumps the inspector to the relevant span or the Evaluators tab.
### Span navigator
The left pane lists every span in the run. Two layouts, toggled at the top:
* **Waterfall** — spans on a shared timeline with duration bars, so you see where wall-clock time went.
* **Tree** — the call hierarchy, so you see who called whom.
Each row shows the span's kind (a colored icon + label), name, agent, cost, tokens, and its start offset from the trace start (e.g. `+1.24s`). Above the tree:
* **Kind pills** — one per span kind present (LLM, Tool, Agent, Plan, RAG, …), each with a count; click to filter to that kind.
* **All / Errors / Critical path** — the critical-path filter shows only the ancestors and descendants of the failing (or slowest) span.
* **Search** — filter by name, agent, or kind.
The tree is fully keyboard-navigable (arrow keys to move, expand/collapse, Enter to select), and cross-service traces render service badges, transport labels, and a continuation node for a subtree whose upstream parent wasn't ingested here.
### Inspector
The right pane is a resizable inspector. With no span selected it shows **trace-overview** tabs; click a span (or a navigator row) and it becomes that span's detail.
Trace-overview tabs:
| Tab | What it shows |
| -------------- | ---------------------------------------------------------------------------------------------------------------------------------------- |
| **I/O** | The trace's input and final output, a token breakdown (input / cached / output / reasoning), and where wall-clock time went by span kind |
| **Flow** | The agent/tool call graph — see [Flow diagram](#flow-diagram) |
| **Flame** | Span durations on a timeline — see [Flame graph](#flame-graph) |
| **Evaluators** | Every evaluator score on the run, with threshold, verdict, judge model, and reasoning |
| **Agents** | Per-agent rollup (spans, tokens, cost, latency, tools, delegate/delegated role) and the delegation chain |
| **Root cause** | AI root-cause analysis, on runs that failed — see [Root cause](#root-cause) |
| **Retrieval** | Retrieved RAG chunks and per-retrieval-span context counts, when the run did retrieval — see [Retrieval](#retrieval) |
| **A2A** | Agent-to-Agent task lifecycle (task/context IDs, state, and the transition history), when present |
| **Log stream** | The run as a flat, timestamped start/end event log |
| **Metadata** | Trace ID, environment, user/session, tags, and the raw metadata object |
| **Session** | The conversation this trace belongs to — see [Session context](#session-context) |
Per-span detail shows the span's **identity** (its own ID and parent ID, with copy buttons and a **copy-link-to-span** permalink), an I/O tab (prompt, system prompt, completion, tool args/result, decision rationale, RAG chunks, and image/video generation fields), a Metadata tab, and an Evaluators tab when scores target that span.
The span permalink writes a `?span=` deep link. Open it and the trace loads with that exact span selected — handy for pasting a specific step into a support ticket or incident doc.
### Flow diagram
The **Flow** tab draws the run as a node graph — one node per span, connected by its call structure — with two layouts you toggle: **Hierarchical** (who called whom) and **Chronological** (positioned by wall-clock start). Edges are labeled by kind (delegation, tool call, infers) and colored, failed steps stand out, and each node carries an execution-order badge. Pan and zoom with the mouse, fit-to-width, lock panning, or open **full screen**. Click a node to inspect that span.
### Flame graph
The **Flame** tab shows span durations as stacked bars, one row per depth level, in two modes: **Chronological** (bars positioned by wall-clock time — gaps are real idle time) and **Hierarchical** (each parent's width divided among its children by duration share — fully packed, so structure reads cleanly on a mostly-idle run). Bars are colored by span kind, with a legend that reflects the kinds actually present. Open it **full screen** for a taller view. Click a bar to inspect that span.
### Retrieval
For a RAG run, the **Retrieval** tab surfaces the retrieved documents — chunk text, document/chunk IDs, source, and relevance score — and a per-retrieval-span context count. Retrieval is captured automatically by the LangChain and LlamaIndex integrations, or explicitly for manual RAG via [`recordRetrieval()` / `record_retrieval()`](/sdk/manual-spans#recording-retrieved-documents). This is the same context the [RAG evaluators](/dashboard/evaluations#evaluating-rag-pipelines) score.
### Session context
When a trace belongs to a session (an SDK-supplied `session_id`), the **Session** tab shows the whole conversation: a rollup (user, turn count, total duration and cost) and every sibling trace in the session — the current one highlighted — each linking to its own trace. Traces without a session don't show the tab.
### Guardrail violations in the trace
When a guardrail check blocks, warns, or redacts something during a run, the violation appears as its own span in the navigator and the flow/flame views — positioned as a child of the span it evaluated, colored to match the guardrail outcome, right alongside the tool call and LLM spans instead of in a separate log you have to cross-reference.
Select the guardrail span to see which policy fired, the check phase (pre or post), and the exact value that triggered it. From there, click **Promote to Policy** to turn that one violation into a permanent guardrail rule — the tool, field, and value are pre-filled from the violation itself. See [Promoting a violation to a policy](/dashboard/guardrails#promoting-a-violation-to-a-policy).
### Delegation compliance
When a span shows `Delegated from `, a compact badge next to the agent's name (in the Agents tab and on the flow graph) summarizes that agent's guardrail-compliance history: pass rate, violation count, and its most recent violation. This is pulled from **anywhere in your organization** — every project, not just the current one — so you can see at the moment of a handoff whether the agent you're about to trust has a clean record elsewhere in your org.
| Badge | Meaning |
| --------------------------- | --------------------------------------------------------------------- |
| Green, `≥95% pass` | Reliable track record |
| Yellow, `80–94% pass` | Some recent violations — worth a look |
| Red, `<80% pass` | Frequent violations |
| "No compliance history yet" | This agent name has no recorded guardrail checks anywhere in your org |
The same badge appears on that agent's own page in the [Agent Registry](/dashboard/agent-registry#compliance-history).
### Root cause
AI root cause analysis requires the Pro plan or higher.
Click **Explain** on the verdict banner, or open the **Root cause** tab, to run an AI root-cause analysis on the full agent trace. Zespan examines all spans — timing, errors, token counts, tool call results, and agent delegation chains — and returns:
* A plain-English summary of the entire agent run
* The identified root cause type (e.g. `tool_failure`, `token_limit_exceeded`, `agent_loop`)
* The specific problem span, and — for a multi-agent run — the **causal agent**: which upstream agent's output poisoned the downstream failure, and at which handoff step
* Contributing factors across the trace
* Step-by-step fix recommendations with implementation notes
* A prevention tip
Analysis takes 5–30 seconds and results are cached for 48 hours.
If a trace has no errors but latency is unexpectedly high, root cause analysis can still help — it identifies slow spans and suggests optimizations even when every span shows a success status.