> ## Documentation Index
> Fetch the complete documentation index at: https://docs.zespan.com/llms.txt
> Use this file to discover all available pages before exploring further.
# Tools
> Track every tool your agents call — usage counts, failure rates, latency, and argument/return value inspection.
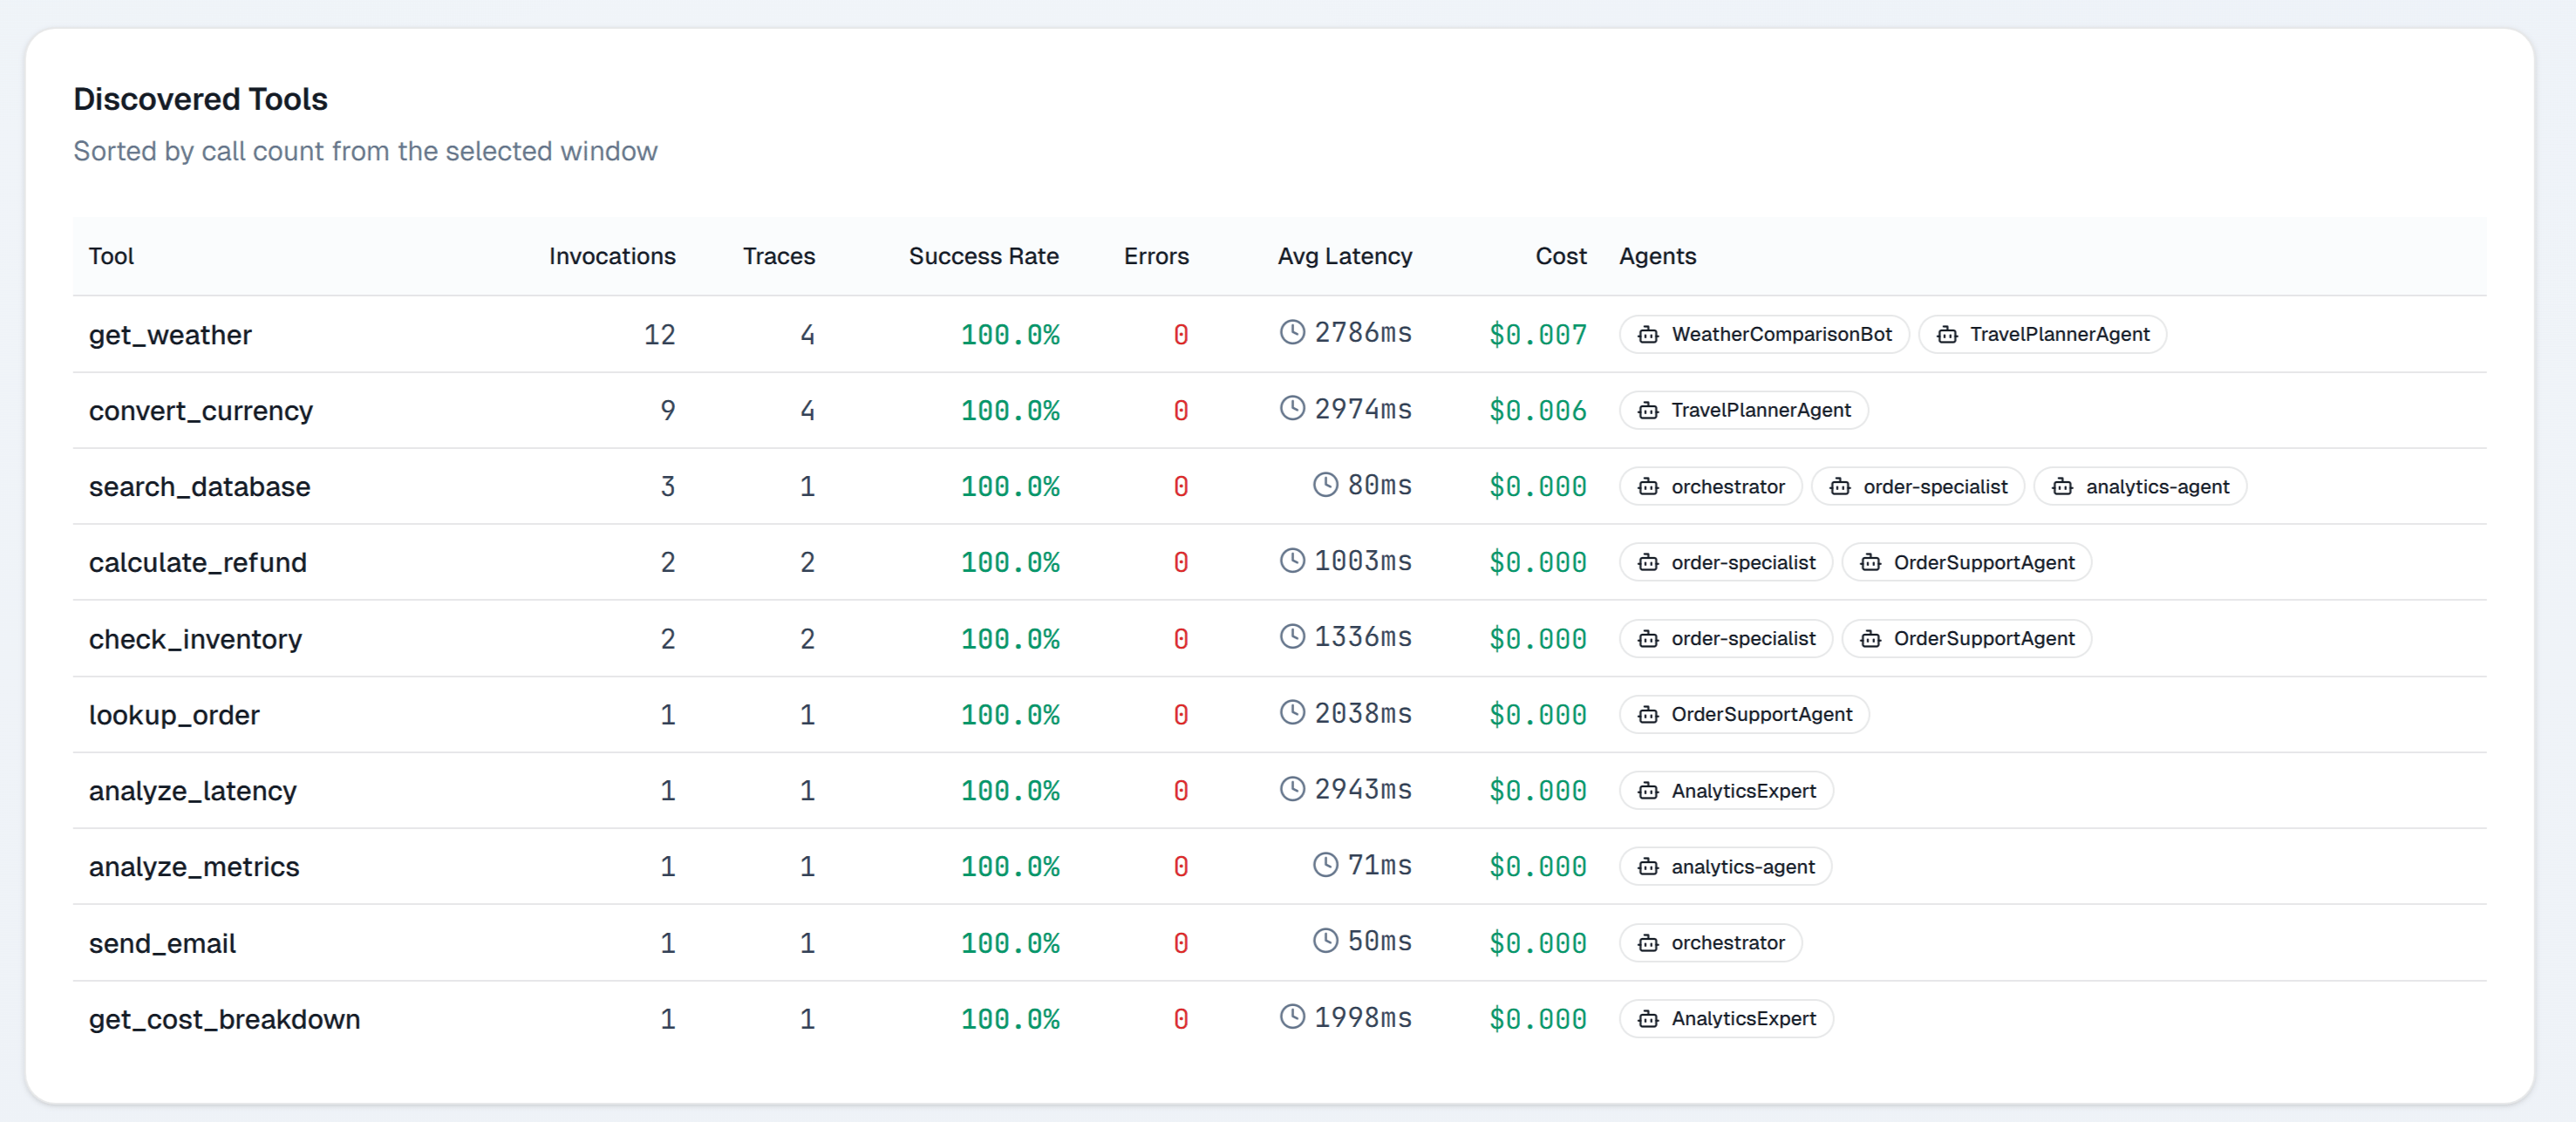
The Tools view shows every tool your agents have called, aggregated across all traces. Use it to find slow tools that bottleneck agent performance, high-failure tools that need fixing, and underused tools that may indicate agents are routing poorly.
 ## Tool list
The tool list shows all tools called in the selected time range:
| Column | Details |
| ------------ | ------------------------------------------ |
| Tool name | The tool identifier from the SDK span |
| Calls | Total invocation count |
| Failure rate | Percentage of calls that returned an error |
| Avg latency | Mean duration per call |
| Agents | How many distinct agents called this tool |
| Last called | Timestamp of the most recent call |
Sort by failure rate to prioritize reliability work. Sort by avg latency to find performance bottlenecks.
## Tool detail
Click any tool to open its detail page.
### Call history
A paginated list of recent calls with timestamp, agent, input arguments (if `storePrompts` is enabled), return value summary, latency, and outcome.
### Latency distribution
A histogram of call durations. A bimodal distribution (two peaks) often indicates cache hit vs cache miss behavior or fast vs slow execution paths.
### Calling agents
A ranked list of agents that call this tool, with per-agent call counts and failure rates. If one agent has a much higher failure rate than others calling the same tool, the issue is likely in how that agent constructs the tool arguments.
## Tool span types
Zespan records tool calls as spans of kind `tool`. Retrieval operations (vector search, document fetch) are recorded as spans of kind `retriever`. Both appear in the Tools view.
See [Span kinds](/reference/span-kinds) for the full list of span types and what each captures.
## Registering tools in code
Tools appear automatically when your agent makes calls that the SDK recognizes as tool spans. For custom tools, wrap the tool function with a manual span:
```typescript theme={"theme":{"light":"github-light","dark":"one-dark-pro"}}
import { startSpan } from "@zespan/sdk";
async function searchDatabase(query: string) {
return startSpan({ name: "search-database", kind: "tool" }, async (span) => {
span.setAttributes({ "tool.input": query });
const result = await db.search(query);
span.setAttributes({ "tool.output.count": result.length });
return result;
});
}
```
See [Manual spans](/sdk/manual-spans) for full span API reference.
## Next steps
* [Traces](/dashboard/traces) — inspect individual tool calls in context
* [Manual spans](/sdk/manual-spans) — instrument custom tools
* [Span kinds](/reference/span-kinds) — span type reference
## Tool list
The tool list shows all tools called in the selected time range:
| Column | Details |
| ------------ | ------------------------------------------ |
| Tool name | The tool identifier from the SDK span |
| Calls | Total invocation count |
| Failure rate | Percentage of calls that returned an error |
| Avg latency | Mean duration per call |
| Agents | How many distinct agents called this tool |
| Last called | Timestamp of the most recent call |
Sort by failure rate to prioritize reliability work. Sort by avg latency to find performance bottlenecks.
## Tool detail
Click any tool to open its detail page.
### Call history
A paginated list of recent calls with timestamp, agent, input arguments (if `storePrompts` is enabled), return value summary, latency, and outcome.
### Latency distribution
A histogram of call durations. A bimodal distribution (two peaks) often indicates cache hit vs cache miss behavior or fast vs slow execution paths.
### Calling agents
A ranked list of agents that call this tool, with per-agent call counts and failure rates. If one agent has a much higher failure rate than others calling the same tool, the issue is likely in how that agent constructs the tool arguments.
## Tool span types
Zespan records tool calls as spans of kind `tool`. Retrieval operations (vector search, document fetch) are recorded as spans of kind `retriever`. Both appear in the Tools view.
See [Span kinds](/reference/span-kinds) for the full list of span types and what each captures.
## Registering tools in code
Tools appear automatically when your agent makes calls that the SDK recognizes as tool spans. For custom tools, wrap the tool function with a manual span:
```typescript theme={"theme":{"light":"github-light","dark":"one-dark-pro"}}
import { startSpan } from "@zespan/sdk";
async function searchDatabase(query: string) {
return startSpan({ name: "search-database", kind: "tool" }, async (span) => {
span.setAttributes({ "tool.input": query });
const result = await db.search(query);
span.setAttributes({ "tool.output.count": result.length });
return result;
});
}
```
See [Manual spans](/sdk/manual-spans) for full span API reference.
## Next steps
* [Traces](/dashboard/traces) — inspect individual tool calls in context
* [Manual spans](/sdk/manual-spans) — instrument custom tools
* [Span kinds](/reference/span-kinds) — span type reference