> ## Documentation Index
> Fetch the complete documentation index at: https://docs.zespan.com/llms.txt
> Use this file to discover all available pages before exploring further.
# Sessions — track multi-turn user conversations
> Use session IDs to group multiple LLM calls from a single user conversation and analyze session-level cost, latency, and turn count in the Sessions dashboard.
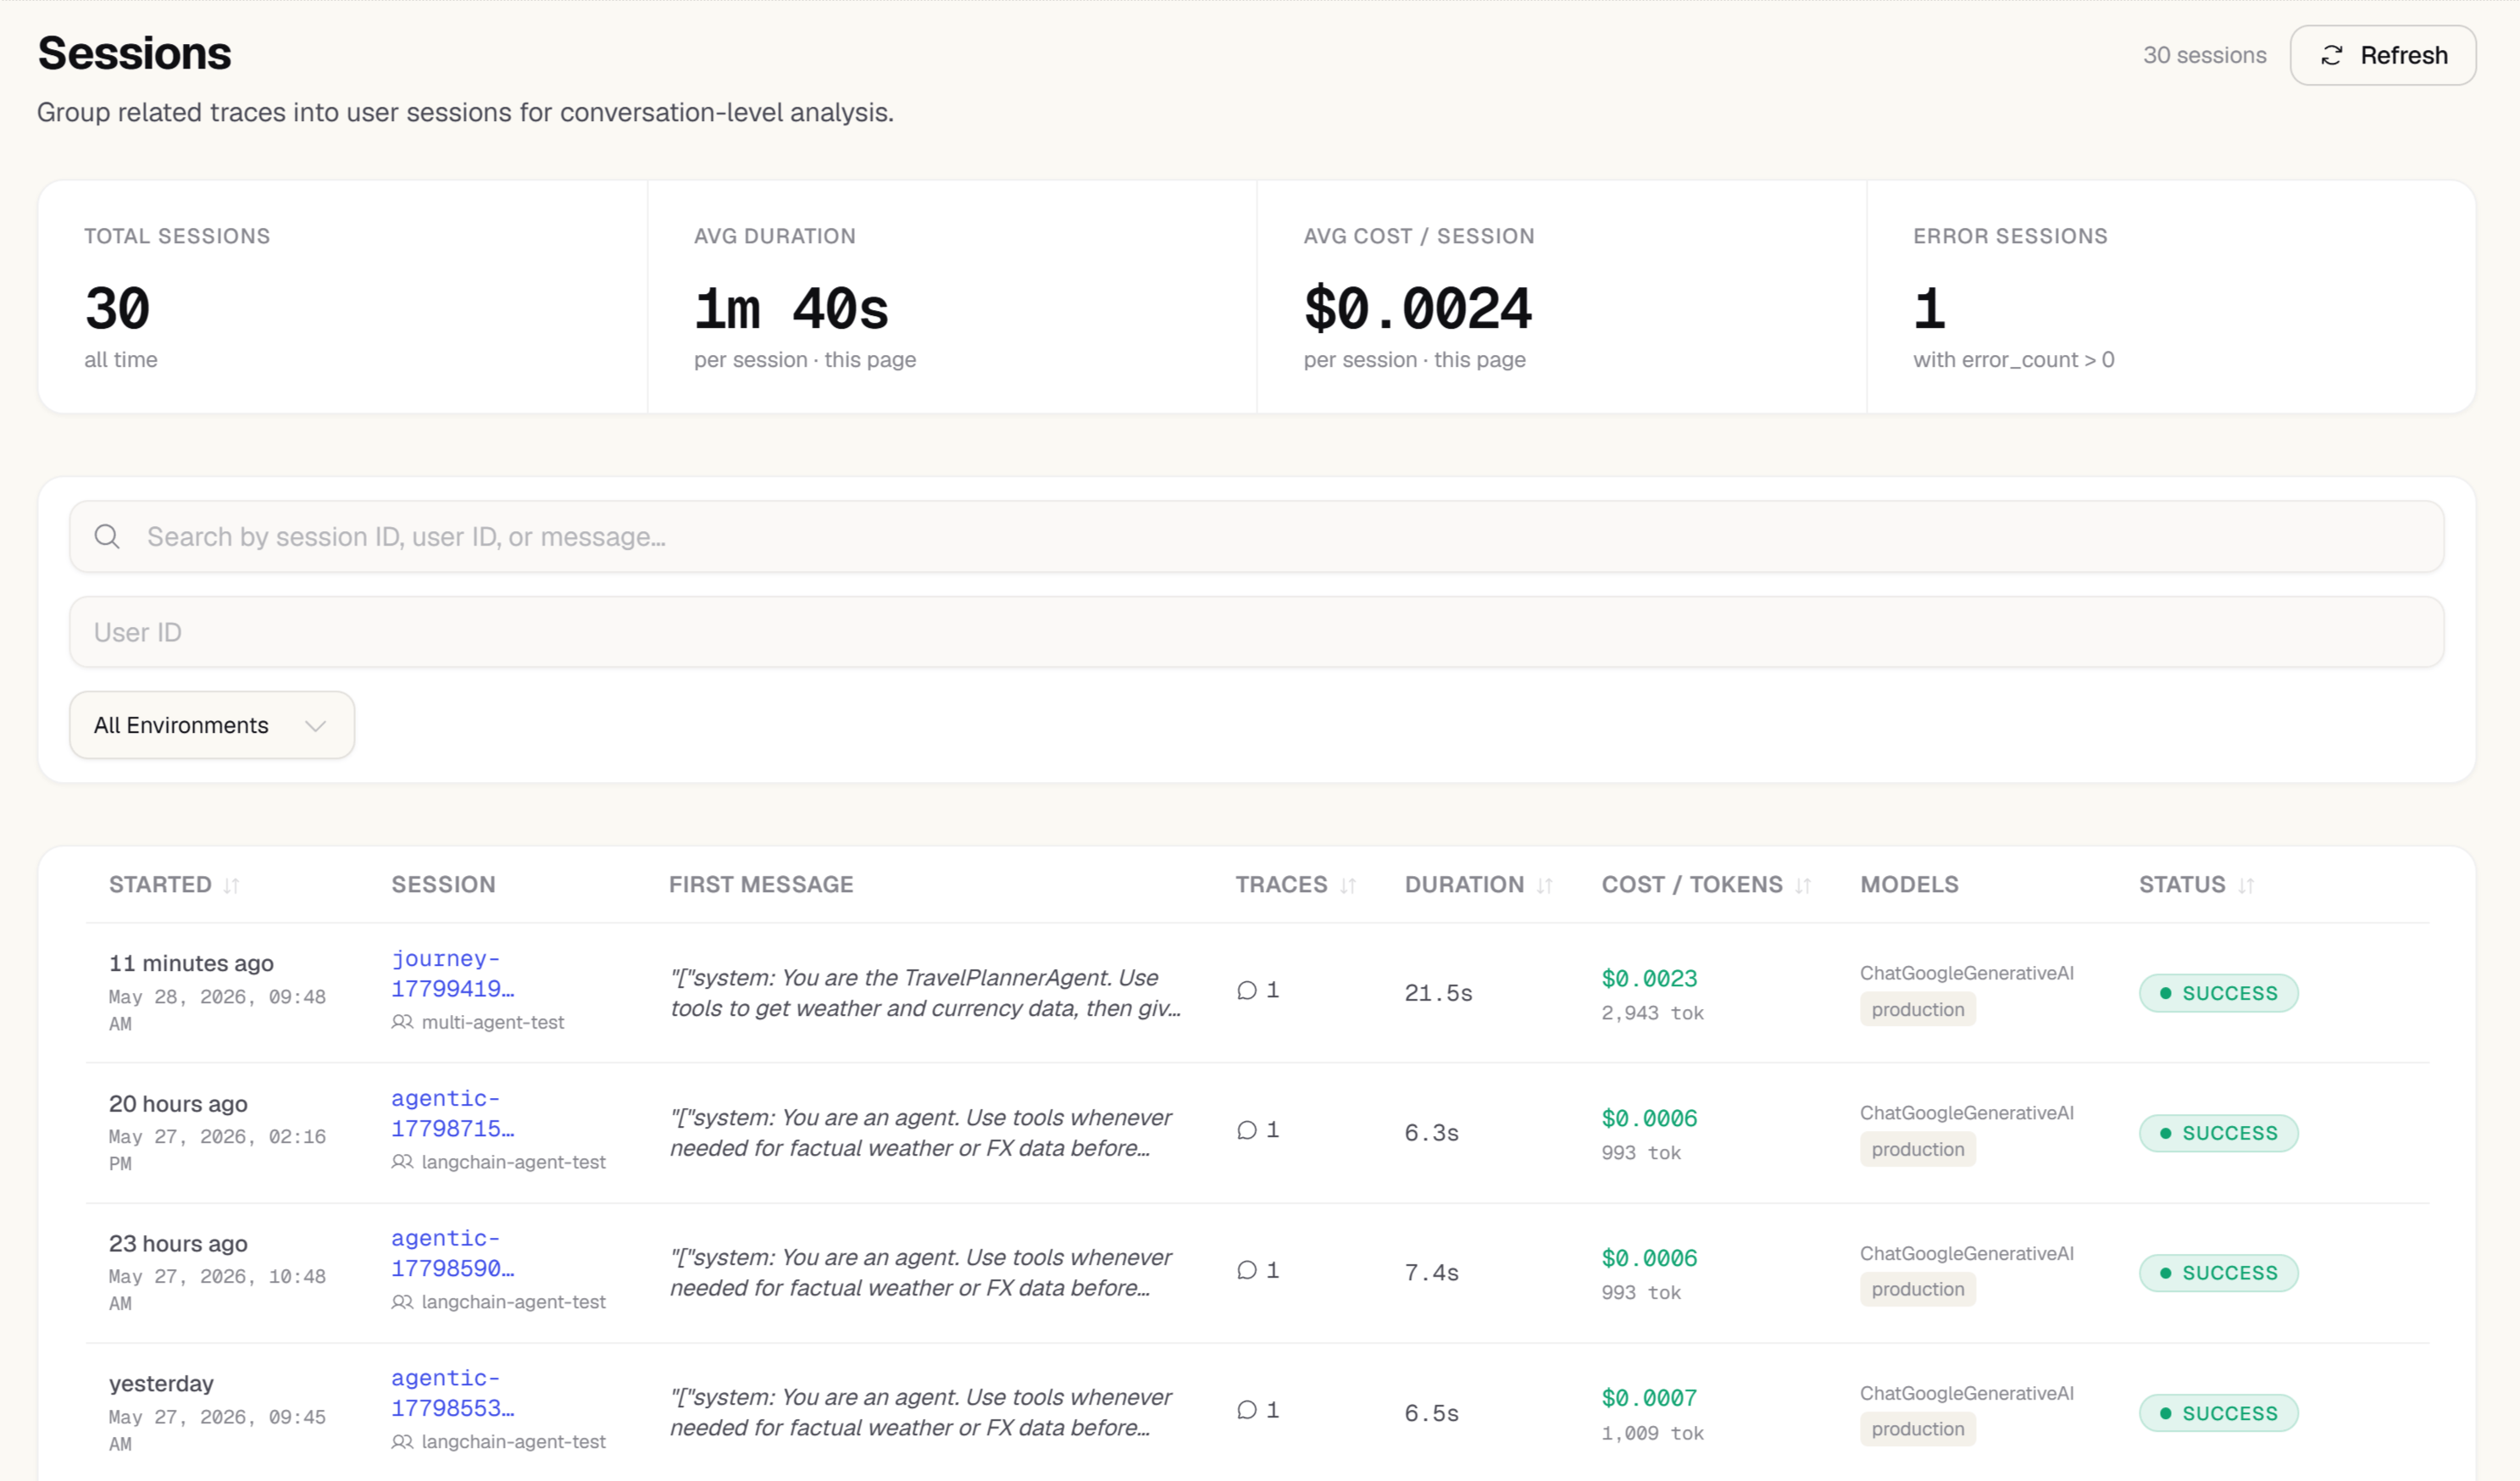
A session groups all LLM calls from a single user conversation into a single unit of analysis. Where the Traces view shows individual LLM API calls, the Sessions view shows full conversations — how many turns they had, how much they cost in total, and how long they lasted from first to last message.
 ## Setting up session tracking
To use the Sessions view, pass a `sessionId` when initializing your trace context. The session ID should be stable for the duration of a conversation — typically a UUID you generate when the conversation starts.
```typescript theme={"theme":{"light":"github-light","dark":"one-dark-pro"}}
import { zespan, withZespanContext } from "@zespan/sdk";
import OpenAI from "openai";
zespan.init({ apiKey: process.env.ZESPAN_API_KEY! });
const openai = zespan.wrapOpenAI(new OpenAI());
// Generate once per conversation
const sessionId = crypto.randomUUID();
async function handleMessage(userId: string, message: string) {
return withZespanContext(
{ userId, sessionId },
async () => {
const response = await openai.chat.completions.create({
model: "gpt-4o",
messages: [{ role: "user", content: message }],
});
return response.choices[0].message.content;
}
);
}
```
```python theme={"theme":{"light":"github-light","dark":"one-dark-pro"}}
import zespan
from zespan import with_zespan_context
import uuid
zespan.init(api_key="zsp_your_api_key_here")
zespan.patch_openai()
import openai
client = openai.OpenAI()
session_id = str(uuid.uuid4()) # Generated once per conversation
def handle_message(user_id: str, message: str) -> str:
with with_zespan_context(user_id=user_id, session_id=session_id):
response = client.chat.completions.create(
model="gpt-4o",
messages=[{"role": "user", "content": message}],
)
return response.choices[0].message.content
```
All LLM calls made within the same `sessionId` are linked together in the Sessions view, regardless of which trace they belong to.
## The sessions list
The Sessions page shows a paginated table of all sessions in your project:
| Column | Description |
| ---------- | ------------------------------------------------ |
| Session ID | The identifier you provided |
| User ID | The user associated with the session (if set) |
| Started | When the first LLM call in this session was made |
| Duration | Time from first to last call |
| Turns | Number of LLM calls in the session |
| Cost | Total cost across all calls in the session |
| Status | Whether the session ended with any errors |
Sort by **Cost** to find your most expensive sessions. Sort by **Turns** to find conversations with the highest round-trip count — a candidate for prompt optimization.
### Filtering sessions
Use the filter bar to narrow the list by:
* **Date range** — see sessions from a specific period
* **User ID** — view all sessions for a specific user
* **Status** — filter to sessions with errors
* **Minimum turns** — find longer conversations
The sessions list is time-bounded: it defaults to the **last 7 days** even before you touch any filter, so a project with a long history doesn't run an unbounded scan on every page load. Use the date-range picker in the filter bar to widen the window (for example, the last 24 hours or 30 days) or pick an explicit start and end date. A session with no activity inside the selected window won't appear in the list — widen the range before assuming a session doesn't exist.
## Session detail
Click any session row to open its detail view. The detail view shows:
### Conversation timeline
A sequential list of every LLM call in the session, in chronological order. Each entry shows the model, latency, token count, and cost for that call. Click any entry to open the full trace flame graph.
### Session metrics
* **Total cost** — cumulative spend across all calls
* **Total tokens** — combined input and output tokens
* **Average latency per turn** — mean response time across all calls
* **Error count** — number of calls that ended in an error state
### User attribution
If the session was associated with a `userId`, the user's full session history is available from a link at the top of the detail view. This lets you see all sessions for a user in one place — useful for investigating a user complaint or analysing high-value customers.
### Conversation-level eval score
If any session-scope evaluator has judged this conversation, a badge reading **Conversation: Pass/Fail · N evaluators** appears on the session detail page. This is a distinct signal from the per-trace evaluator scores shown on individual calls in the conversation timeline — one score judges a single LLM call, the other judges the whole conversation. See [Session-level evaluation](#session-level-evaluation) below for how to configure it.
## Session-level evaluation
Every evaluator described on the [Evaluations](/dashboard/evaluations) page normally scores one trace at a time. A **session-scope** evaluator instead judges an entire conversation — every trace sharing a `sessionId`, folded into one ordered transcript — so you can catch quality problems that only show up across multiple turns (the assistant contradicting itself, losing context, or drifting off-topic over a long back-and-forth) rather than in any single call.
### What it is
A session-scope evaluator runs the same LLM-as-judge pipeline as a regular evaluator, but the "trace" it's handed is the full transcript of the conversation instead of one prompt/completion pair. The resulting score is written with the conversation's `sessionId` attached and no `traceId`/`spanId` — it's a property of the conversation, not of any one call in it. Because a conversation can span multiple models across turns, a session-level score also has no single "model" or "provider" attached to it.
### Configuring a session-scope evaluator
Session scope is a property of the evaluator template, set alongside its other configuration (rubric, score type, threshold): `scope: "session"` instead of the default `"trace"`. The **Create Custom Template** dialog on the Evaluations page doesn't yet expose a scope toggle, so set it via the API when creating or updating a template:
```bash theme={"theme":{"light":"github-light","dark":"one-dark-pro"}}
curl -X POST https://api.zespan.com/v1/projects/{projectId}/evaluation-templates \
-H "Authorization: Bearer $ZESPAN_API_KEY" \
-H "Content-Type: application/json" \
-d '{
"name": "Conversation coherence",
"category": "quality",
"evaluatorType": "llm_judge",
"metricKey": "conversation_coherence",
"defaultThreshold": 0.7,
"systemPrompt": "Judge whether the assistant stayed coherent and consistent across the whole conversation...",
"scope": "session"
}'
```
Once the template exists, click **Deploy** on its row in the **Templates** tab the same way you'd deploy any built-in or custom template — the scope carries over automatically to the live evaluator.
A session-scope evaluator is excluded from the normal per-trace auto-evaluation path entirely — it never scores an individual trace, only whole sessions once they're detected as complete (see below).
### How "session complete" is detected
There's no explicit "close this session" call in the SDK — a conversation can always receive one more turn. Instead, Zespan detects a session as complete by **quiescence**: a session is considered done once it has gone **30 minutes** (default) with no new activity. This is configurable via the `SESSION_QUIET_MINUTES` environment variable.
A background scan checks for newly-quiet sessions on a 10-minute cron tick, and only looks at projects that have at least one enabled session-scope evaluator — most projects have none, so this stays cheap. Once a session is found quiet, it's queued for session-level evaluation; the judge then runs against the full transcript and the resulting scores appear on the session detail page shortly after.
## Cost attribution by session
In addition to per-model cost breakdown, the Sessions view helps answer questions like:
* "Which types of conversations cost the most?"
* "Are there sessions where users are burning through tokens disproportionately?"
* "What is my average cost per conversation?"
Sort sessions by cost and examine the top 10 most expensive sessions. If they share a common pattern — a specific feature, user segment, or prompt style — that's where to focus optimization effort first.
## Plan requirements
Session tracking is available on all plans. The Sessions page is populated automatically as long as your SDK passes `sessionId` in its trace context. No additional configuration is required.
Data retention for session data follows your plan's retention window — 14 days on Free, 30 days on Solo, 90 days on Pro, 180 days on Team, 1 year on Scale. Sessions and traces older than the window are excluded from every response, so widening a date-range filter past your retention window returns nothing extra.
## Setting up session tracking
To use the Sessions view, pass a `sessionId` when initializing your trace context. The session ID should be stable for the duration of a conversation — typically a UUID you generate when the conversation starts.
```typescript theme={"theme":{"light":"github-light","dark":"one-dark-pro"}}
import { zespan, withZespanContext } from "@zespan/sdk";
import OpenAI from "openai";
zespan.init({ apiKey: process.env.ZESPAN_API_KEY! });
const openai = zespan.wrapOpenAI(new OpenAI());
// Generate once per conversation
const sessionId = crypto.randomUUID();
async function handleMessage(userId: string, message: string) {
return withZespanContext(
{ userId, sessionId },
async () => {
const response = await openai.chat.completions.create({
model: "gpt-4o",
messages: [{ role: "user", content: message }],
});
return response.choices[0].message.content;
}
);
}
```
```python theme={"theme":{"light":"github-light","dark":"one-dark-pro"}}
import zespan
from zespan import with_zespan_context
import uuid
zespan.init(api_key="zsp_your_api_key_here")
zespan.patch_openai()
import openai
client = openai.OpenAI()
session_id = str(uuid.uuid4()) # Generated once per conversation
def handle_message(user_id: str, message: str) -> str:
with with_zespan_context(user_id=user_id, session_id=session_id):
response = client.chat.completions.create(
model="gpt-4o",
messages=[{"role": "user", "content": message}],
)
return response.choices[0].message.content
```
All LLM calls made within the same `sessionId` are linked together in the Sessions view, regardless of which trace they belong to.
## The sessions list
The Sessions page shows a paginated table of all sessions in your project:
| Column | Description |
| ---------- | ------------------------------------------------ |
| Session ID | The identifier you provided |
| User ID | The user associated with the session (if set) |
| Started | When the first LLM call in this session was made |
| Duration | Time from first to last call |
| Turns | Number of LLM calls in the session |
| Cost | Total cost across all calls in the session |
| Status | Whether the session ended with any errors |
Sort by **Cost** to find your most expensive sessions. Sort by **Turns** to find conversations with the highest round-trip count — a candidate for prompt optimization.
### Filtering sessions
Use the filter bar to narrow the list by:
* **Date range** — see sessions from a specific period
* **User ID** — view all sessions for a specific user
* **Status** — filter to sessions with errors
* **Minimum turns** — find longer conversations
The sessions list is time-bounded: it defaults to the **last 7 days** even before you touch any filter, so a project with a long history doesn't run an unbounded scan on every page load. Use the date-range picker in the filter bar to widen the window (for example, the last 24 hours or 30 days) or pick an explicit start and end date. A session with no activity inside the selected window won't appear in the list — widen the range before assuming a session doesn't exist.
## Session detail
Click any session row to open its detail view. The detail view shows:
### Conversation timeline
A sequential list of every LLM call in the session, in chronological order. Each entry shows the model, latency, token count, and cost for that call. Click any entry to open the full trace flame graph.
### Session metrics
* **Total cost** — cumulative spend across all calls
* **Total tokens** — combined input and output tokens
* **Average latency per turn** — mean response time across all calls
* **Error count** — number of calls that ended in an error state
### User attribution
If the session was associated with a `userId`, the user's full session history is available from a link at the top of the detail view. This lets you see all sessions for a user in one place — useful for investigating a user complaint or analysing high-value customers.
### Conversation-level eval score
If any session-scope evaluator has judged this conversation, a badge reading **Conversation: Pass/Fail · N evaluators** appears on the session detail page. This is a distinct signal from the per-trace evaluator scores shown on individual calls in the conversation timeline — one score judges a single LLM call, the other judges the whole conversation. See [Session-level evaluation](#session-level-evaluation) below for how to configure it.
## Session-level evaluation
Every evaluator described on the [Evaluations](/dashboard/evaluations) page normally scores one trace at a time. A **session-scope** evaluator instead judges an entire conversation — every trace sharing a `sessionId`, folded into one ordered transcript — so you can catch quality problems that only show up across multiple turns (the assistant contradicting itself, losing context, or drifting off-topic over a long back-and-forth) rather than in any single call.
### What it is
A session-scope evaluator runs the same LLM-as-judge pipeline as a regular evaluator, but the "trace" it's handed is the full transcript of the conversation instead of one prompt/completion pair. The resulting score is written with the conversation's `sessionId` attached and no `traceId`/`spanId` — it's a property of the conversation, not of any one call in it. Because a conversation can span multiple models across turns, a session-level score also has no single "model" or "provider" attached to it.
### Configuring a session-scope evaluator
Session scope is a property of the evaluator template, set alongside its other configuration (rubric, score type, threshold): `scope: "session"` instead of the default `"trace"`. The **Create Custom Template** dialog on the Evaluations page doesn't yet expose a scope toggle, so set it via the API when creating or updating a template:
```bash theme={"theme":{"light":"github-light","dark":"one-dark-pro"}}
curl -X POST https://api.zespan.com/v1/projects/{projectId}/evaluation-templates \
-H "Authorization: Bearer $ZESPAN_API_KEY" \
-H "Content-Type: application/json" \
-d '{
"name": "Conversation coherence",
"category": "quality",
"evaluatorType": "llm_judge",
"metricKey": "conversation_coherence",
"defaultThreshold": 0.7,
"systemPrompt": "Judge whether the assistant stayed coherent and consistent across the whole conversation...",
"scope": "session"
}'
```
Once the template exists, click **Deploy** on its row in the **Templates** tab the same way you'd deploy any built-in or custom template — the scope carries over automatically to the live evaluator.
A session-scope evaluator is excluded from the normal per-trace auto-evaluation path entirely — it never scores an individual trace, only whole sessions once they're detected as complete (see below).
### How "session complete" is detected
There's no explicit "close this session" call in the SDK — a conversation can always receive one more turn. Instead, Zespan detects a session as complete by **quiescence**: a session is considered done once it has gone **30 minutes** (default) with no new activity. This is configurable via the `SESSION_QUIET_MINUTES` environment variable.
A background scan checks for newly-quiet sessions on a 10-minute cron tick, and only looks at projects that have at least one enabled session-scope evaluator — most projects have none, so this stays cheap. Once a session is found quiet, it's queued for session-level evaluation; the judge then runs against the full transcript and the resulting scores appear on the session detail page shortly after.
## Cost attribution by session
In addition to per-model cost breakdown, the Sessions view helps answer questions like:
* "Which types of conversations cost the most?"
* "Are there sessions where users are burning through tokens disproportionately?"
* "What is my average cost per conversation?"
Sort sessions by cost and examine the top 10 most expensive sessions. If they share a common pattern — a specific feature, user segment, or prompt style — that's where to focus optimization effort first.
## Plan requirements
Session tracking is available on all plans. The Sessions page is populated automatically as long as your SDK passes `sessionId` in its trace context. No additional configuration is required.
Data retention for session data follows your plan's retention window — 14 days on Free, 30 days on Solo, 90 days on Pro, 180 days on Team, 1 year on Scale. Sessions and traces older than the window are excluded from every response, so widening a date-range filter past your retention window returns nothing extra.