> ## Documentation Index
> Fetch the complete documentation index at: https://docs.zespan.com/llms.txt
> Use this file to discover all available pages before exploring further.
# Evaluations — measure and trend custom LLM metrics
> Define custom evaluation metrics, run them against your traces, and track results over time to detect quality regressions and measure the impact of prompt changes.
Evaluations let you define custom quality metrics for your LLM outputs and measure them against real production traces.
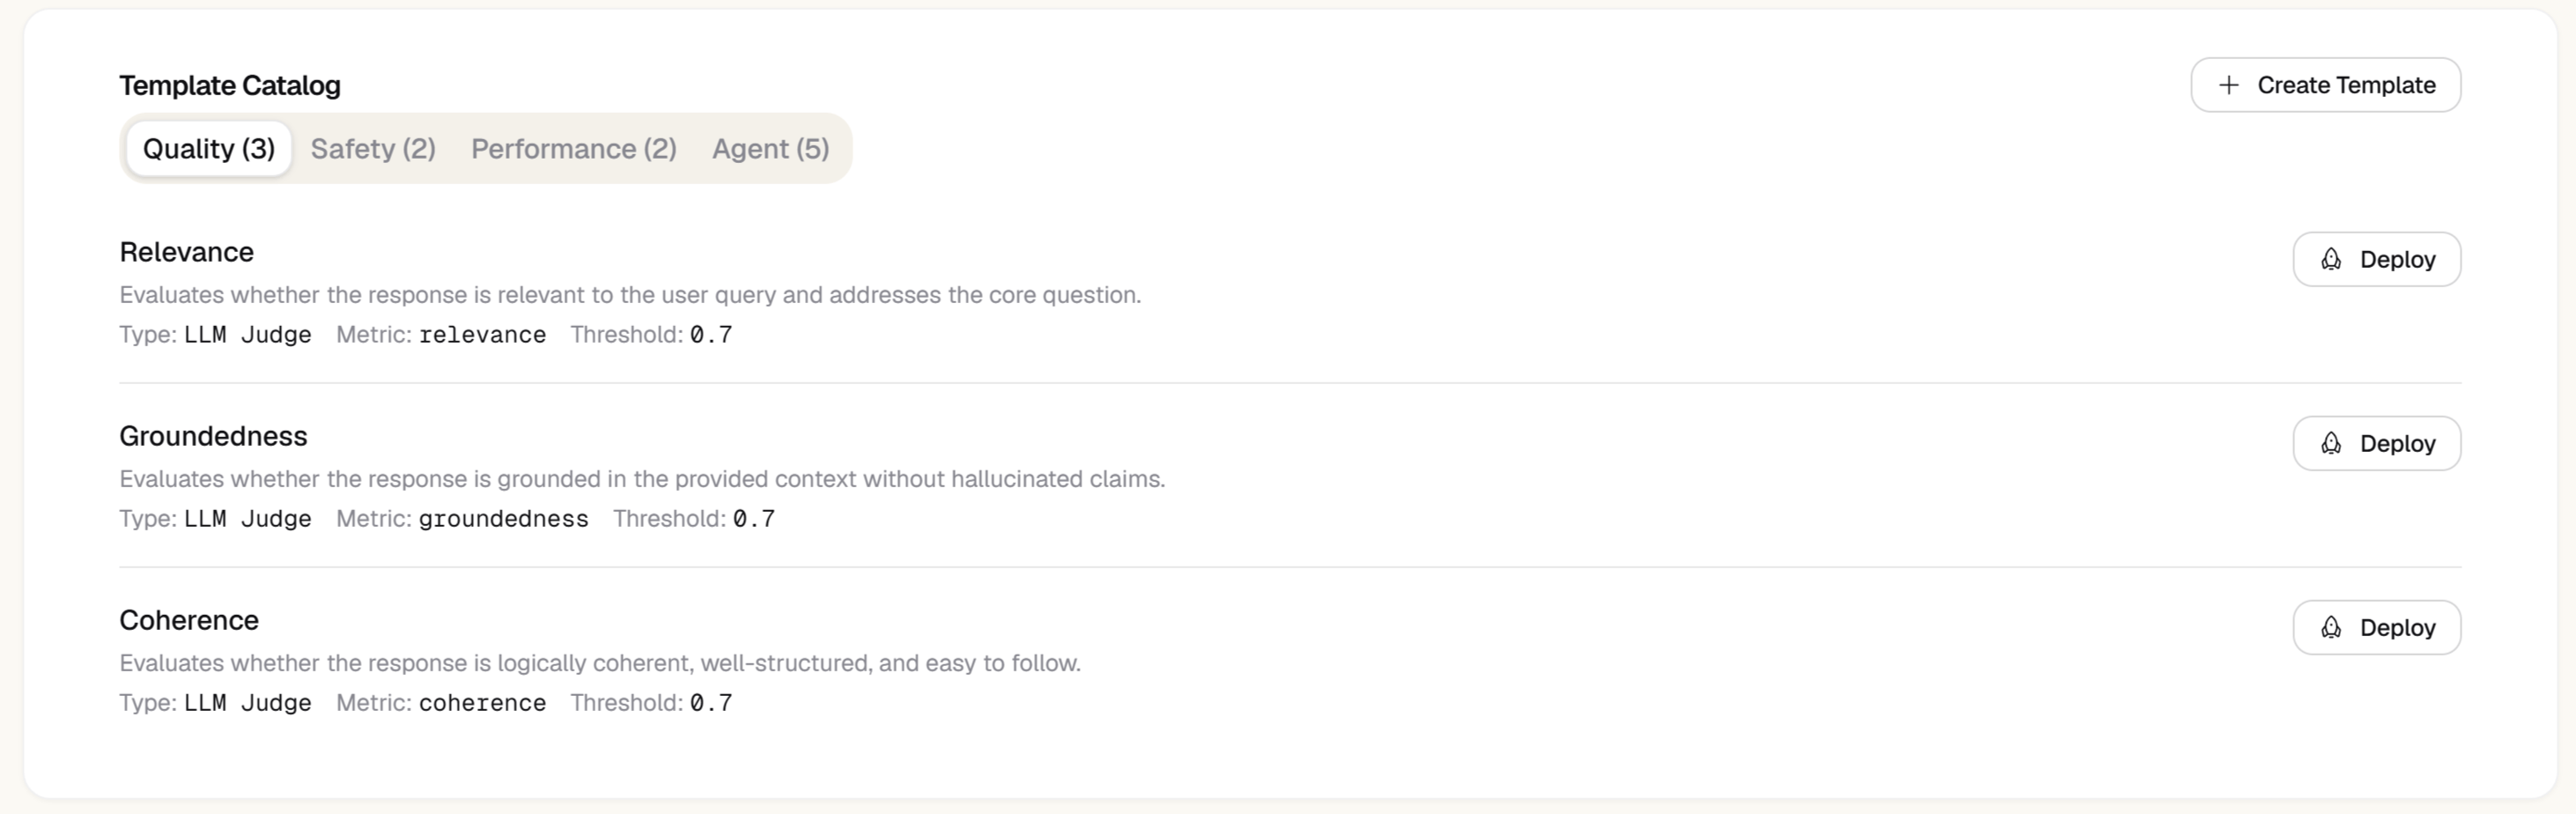 Instead of guessing whether a prompt change improved quality, you define what "good" means numerically, run an evaluation, and see scores trend over time. Zespan uses an LLM-as-judge approach: your evaluator definition is a prompt that an AI model applies to each trace, producing a numeric score.
Auto-evaluations with 12 built-in LLM-as-judge templates are available on **Solo** and above. Manual evaluation runs are available on all plans including Free.
## How evaluations work
An **evaluator** (`EvaluatorDefinition`) is a named metric — at minimum a name, a metric key, and an optional description. When an evaluator runs (manually, on auto-run, or from a dataset-run score) against a trace, Zespan submits the trace's prompt/completion text to an LLM judge, which returns a numeric score. Scores are stored and displayed as trends on the Evaluations page.
There are two ways to get an evaluator with a real rubric:
* **New Evaluator dialog** — the fast path. It only collects Name, Metric Key, and an optional Description; it does not let you write a scoring prompt. An evaluator created this way scores traces using Zespan's generic default judge prompt ("evaluate output quality against input intent, score 0.0–1.0") rather than a rubric you author.
* **Templates → Deploy** — the path for a custom rubric, score range, and input scope. See [Custom evaluator templates](#custom-evaluator-templates) below.
You can also attach scores programmatically from the SDK using `span.setEvalScore()`, bypassing the judge model entirely. Both sources — programmatic and LLM-as-judge — appear in the same dashboard.
## Creating an evaluator
Navigate to **Evaluations** in the left sidebar.
The evaluator creation dialog opens.
Give it a name (e.g. `Factuality Check`) and a metric key (e.g. `custom_relevance`). The metric key becomes the identifier in trend charts. Optionally add a description.
Click **Save**. The evaluator appears in your evaluator list, ready to run with the default judge prompt described above.
If you need a custom scoring prompt, a specific score range, categorical/boolean verdicts, or an input scope (prompt vs. completion vs. both), don't use the New Evaluator dialog — create a [custom template](#custom-evaluator-templates) instead and deploy it. Deploying a template creates the same kind of evaluator, just with your rubric attached instead of the generic default.
Evaluations work on stored prompt and completion text. If you have disabled prompt storage with `storePrompts: false`, evaluation results will be empty — re-enable it to use evaluations.
Creating an evaluator via the New Evaluator dialog requires the **Team** plan or above. Deploying a template into an evaluator does not have this restriction — see [Custom evaluator templates](#custom-evaluator-templates). Editing or deleting an evaluator — however it was created — also requires **Team**. See [Plan limits](#plan-limits).
## Custom evaluator templates
Beyond the built-in library, you can author your own evaluator templates from the **Templates** tab on the Evaluations page. Built-in and custom templates live in the same catalog — you browse both, then deploy any of them into a live evaluator when you're ready. This is where you write an actual scoring prompt/rubric — the New Evaluator dialog above does not expose one.
Navigate to **Evaluations** and select the **Templates** tab.
The **Create Custom Template** dialog opens.
Give the template a name, and a category such as `quality`, `safety`, `performance`, `agent`, or `rag` — or type your own.
This is the rubric the judge model applies to each trace — describe what to look for and how to score it, the same way you would for a built-in template.
The metric key becomes the identifier for this evaluator in trend charts. The threshold (0.0–1.0) is the cutoff score above which a result counts as a pass.
Select how the judge should express its verdict:
* **Numeric** — a score between 0.0 and 1.0
* **Categorical** — the judge picks exactly one label from a list you define, entered as comma-separated values, e.g. `helpful, unhelpful, unclear`
* **Boolean** — a true/false verdict
Override the project's default judge model for this template alone. See [Overriding the judge model per template](#overriding-the-judge-model-per-template) below.
Use **Test on a real trace** to preview scoring before saving — see [Testing a template before you deploy it](#testing-a-template-before-you-deploy-it) below. When you're satisfied, click **Create Template**.
The new template appears in the catalog alongside the built-in ones. Click **Deploy** on its row to turn it into a live evaluator, the same way you would enable any built-in template.
### Overriding the judge model per template
By default, every evaluator uses your project's default judge model. When creating a custom template, you can pin a specific judge for that template instead: choose a provider — **OpenAI**, **Anthropic**, or **Google** — and enter the model name (for example `gpt-4o`, `claude-sonnet-4-20250514`, or `gemini-2.5-flash`). Leave the provider set to its default option to keep using the project's default judge model.
This lets you match judge cost and strength to the rubric — a cheaper, faster model for a simple pass/fail check, a stronger model for a template that requires nuanced judgment.
### Testing a template before you deploy it
Before saving a new template, use the **Preview & Test** panel in the creation dialog to see how it scores. Click **Test on a real trace** to submit your rubric, along with your most recently ingested trace, to the judge model synchronously. The result — a score and the judge's reasoning — appears in the dialog within a few seconds.
A dry run doesn't create an evaluator or save any results. It's a quick check that your rubric produces the score you expect before you commit to deploying it.
Every LLM-judge call — the template dry run above, auto-evaluation, a manual **Run now**, and the ad-hoc playground run described below — requires a project **LLM connection**. Without one, the call fails with "No LLM connection configured — add one in Settings → LLM Connections." Connect a provider key under [LLM Connections](/platform/llm-connections) before using any of these.
### Scope: trace vs. session
Every template above judges a single trace by default (`scope: "trace"`). Setting `scope: "session"` instead makes the deployed evaluator judge an entire conversation — every trace sharing a `sessionId`, folded into one ordered transcript — rather than one call in isolation. This is useful for quality signals that only show up across multiple turns, like the assistant contradicting itself or drifting off-topic over a long back-and-forth.
The **Create Custom Template** dialog doesn't expose a scope toggle yet, so set it via the API when creating or updating a template:
```bash theme={"theme":{"light":"github-light","dark":"one-dark-pro"}}
curl -X POST https://api.zespan.com/v1/projects/{projectId}/evaluation-templates \
-H "Authorization: Bearer $ZESPAN_API_KEY" \
-H "Content-Type: application/json" \
-d '{
"name": "Conversation coherence",
"category": "quality",
"evaluatorType": "llm_judge",
"metricKey": "conversation_coherence",
"defaultThreshold": 0.7,
"systemPrompt": "Judge whether the assistant stayed coherent across the whole conversation...",
"scope": "session"
}'
```
Deploy it from the **Templates** tab the same way as any other template — the scope carries over to the live evaluator automatically. A session-scope evaluator never scores an individual trace; it only runs once a session is detected as complete, and its results are written separately from per-trace scores (no `traceId`/`spanId`, a `sessionId` instead). See [Session-level evaluation](/dashboard/sessions#session-level-evaluation) for how "session complete" is detected and where these scores are surfaced.
## Running evaluations
After creating an evaluator, you run it against a selection of traces.
**Auto-evaluation:** Enable **Auto-run** on an evaluator to have it score every new trace automatically as it arrives. This is useful for monitoring ongoing quality in production.
**Manual run:** Click **Run now** on any evaluator to score a batch of recent traces immediately. You can choose how many recent traces to include (up to 500).
Both modes display results in the evaluator's trend chart within a few minutes of completion.
### Scoring a Playground response
You can also run an evaluator outside this page entirely: on the **Playground** page, each output window has a **Run Eval** action that lets you pick any evaluator from this project and score that window's prompt/response pair synchronously — useful for checking how an evaluator would score a draft response before it ever becomes a trace. Like every other judge call described above, it requires a project LLM connection.
## Sampling and filters for auto-evaluation
When an evaluator is running continuously against live traffic, you can scope exactly which traces it judges instead of scoring every single one. Open the **Evaluators** tab and click the gear icon next to an active evaluator to open **Sampling & Filters**.
You can configure:
* **Sample rate** — a fraction from 0 to 1 of matching traces to judge. Set it to `0.1`, for example, to evaluate roughly 1 in 10 matching traces and control judge-model cost; leave it at `1.0` to evaluate every eligible trace.
* **Minimum output tokens** — skip traces whose output is shorter than this token count, so trivially short responses don't consume judge calls.
* **Models** — a comma-separated list of model names to restrict evaluation to, e.g. `gpt-4o, claude-sonnet-4-20250514`.
* **Operations** — a comma-separated list of operation types to restrict evaluation to, e.g. `chat, completion`.
* **Statuses** — a comma-separated list of trace statuses to restrict evaluation to, e.g. `success`.
Leave any filter blank to match everything. Use the **Sampling Enabled** toggle to turn sampling on or off without losing your configured values, then click **Save** to apply.
Combine sampling and filters to scope auto-evaluation to the slice of traffic you actually care about — for example, judge only 20% of `chat` operations on your production model, skipping short responses that wouldn't produce a meaningful score.
## Reading evaluation results
A **categorical** or **boolean** evaluator (see [Custom evaluator templates](#custom-evaluator-templates)) displays its result as the judge's chosen label, or `true`/`false`, in the **Evaluators** table on the trace detail view. It no longer renders as a 0–100% bar there: a percentage has no meaning for a label like `helpful` or a boolean verdict. This is scoped to that one surface — the cards and tables on this page, and the generic score chip used elsewhere, still show a raw percentage regardless of score type. Numeric evaluators are unaffected everywhere and still show a 2-decimal score with the usual progress bar.
The main Evaluations page shows all your evaluators as cards. Each card displays:
* **Name** — the evaluator identifier
* **Latest score** — the most recent average score across the last batch of evaluated traces
* **Trend** — a sparkline showing how the score has changed over the last 30 days
* **Sample count** — how many traces were scored in the latest run
Click an evaluator card to open the full detail view with:
* A time-series chart of average score by day
* A distribution histogram showing score spread
* A table of individual trace scores with links to the trace detail view
If your evaluator score drops sharply after a deployment, open the **Traces** page and filter to the same time window. The evaluation score is shown in the trace detail panel so you can correlate low-scoring traces with specific model calls.
## Evaluating RAG pipelines
If your traces include retrieval spans — captured automatically by `recordRetrieval()`, the LangChain integration, or attached manually via `span.recordDocuments()` (`span_kind: "retriever"`) — five evaluator templates can score the retrieval step itself, not just the final answer:
| Template | What it checks | Requires retrieved chunks |
| ----------------------- | ------------------------------------------------------------------------------------------------------------------------------------- | ------------------------- |
| **Groundedness** | Whether the response is supported by whatever context is available — retrieved chunks if present, the trace's system prompt otherwise | No — degrades gracefully |
| **RAG Faithfulness** | Whether every claim in the response is specifically supported by the retrieved chunks | Yes |
| **Context Relevance** | Whether the retrieved chunks are actually relevant to the query — judges the retriever, independent of the generated answer | Yes |
| **Context Utilization** | What fraction of retrieved chunks were actually used in the response | Yes |
| **Retrieval Hit Rate** | Deterministic, no LLM call — did the retriever return anything at all | Yes |
All five are reference-free, like every other evaluator on this page — no ground-truth answer set required. Deploy any of them from the **Templates** tab under the **RAG** category, the same way you'd deploy any built-in template.
The four RAG-specific templates — everything except Groundedness — only score traces that actually have a retrieval span with chunks. A trace with no retrieval step is skipped for these evaluators entirely: no score row, no LLM call, no cost, rather than a meaningless score against nothing.
## RAG analytics
The **Retrieval** tab on this page rolls RAG evaluator scores up across traces: a trend card per metric, and a ranked list of your worst-performing retrieval operations — the fastest way to spot a retriever that's degraded on one specific operation before it shows up as a wave of bad answers.
If Retrieval Hit Rate is trending down on an operation, check that first. A faithfulness or context-relevance drop is often downstream of the retriever returning nothing, not the judge model getting worse.
## Attaching scores from the SDK
You can attach evaluation scores to any span programmatically using `span.setEvalScore()`. This is useful when you compute quality scores in your own code — for example, using a custom similarity function for RAG faithfulness.
```typescript theme={"theme":{"light":"github-light","dark":"one-dark-pro"}}
import { zespan, startSpan } from "@zespan/sdk";
const { span } = startSpan({ name: "rag-pipeline", provider: "custom" });
try {
const answer = await generateAnswer(query, docs);
// Attach your computed scores before closing the span
span.setEvalScore("faithfulness", computeFaithfulness(answer, docs));
span.setEvalScore("relevance", computeRelevance(answer, query));
await span.end({ status: "success" });
return answer;
} catch (err) {
await span.end({ status: "error", error_message: String(err) });
throw err;
}
```
```python theme={"theme":{"light":"github-light","dark":"one-dark-pro"}}
from zespan import start_span
with start_span(name="rag-pipeline", provider="custom") as span:
answer = generate_answer(query, docs)
span.set_eval_score("faithfulness", compute_faithfulness(answer, docs))
span.set_eval_score("relevance", compute_relevance(answer, query))
```
Scores attached via the SDK appear in the same trend charts as LLM-as-judge scores. If you attach a score with the same name as an evaluator, both sources are shown together in the detail view — and, as of this dashboard's KPI tiles and metric list, in the aggregate too: `setEvalScore()` results and server-side judge results for the same metric key are combined into one count-weighted average per time bucket rather than only ever appearing in the raw per-trace view. No setup is required on your side; this happens automatically the moment a span carries an eval score.
## Performance & agent evaluators
Four built-in templates score performance and agent-trajectory signals directly from trace data — no LLM call, no judge cost:
| Template | Metric key | What it checks | Requires |
| ----------------------- | --------------------- | ------------------------------------------------------------------------------------------------------------------------------------------- | ---------------------------------- |
| **Latency SLA** | `latency_sla` | Whether the span's `latency_ms` is within a target (default 5000ms) | The span's latency to be recorded |
| **Cost Budget** | `cost_budget` | Whether the span's `cost_usd` is within a budget (default \$0.05) | The span's cost to be recorded |
| **Loop Detection** | `loop_detection` | The longest run of consecutive identical operations across the trace's spans so far — a sign of an agent stuck repeating the same tool call | At least 2 spans in the trace |
| **Error Recovery Rate** | `error_recovery_rate` | Of the trace's error spans, what fraction were followed later by a successful call to the same operation — a retry-and-recover pattern | At least 1 error span in the trace |
Each is a real deterministic check against the trace's own data (`latency_ms`, `cost_usd`, `operation`, `status`) — not a generic LLM quality-judge rubric scoring "output quality" in the abstract. **Loop Detection** and **Error Recovery Rate** skip a trace entirely (no score row, no cost) when there isn't enough signal yet — fewer than 2 spans, or no error spans respectively — rather than fabricate a score against nothing.
`slaTargetMs` (Latency SLA) and `budgetUsd` (Cost Budget) use fixed defaults (5000ms / \$0.05) for every evaluator deployed from these templates. There's no dashboard control to change these per-evaluator yet — reach out if you need a different threshold.
## Retroactive evaluation
An evaluator only auto-scores traffic from the moment it's turned on — but you don't need to have predicted which metric you'd want in advance. The **Retroactive Runs** panel on this page scores historical traces you've already ingested against any evaluator, including one that wasn't configured for auto-run (or didn't exist yet) when that traffic actually happened.
Opens the retroactive-run dialog. Requires at least one evaluator to already exist.
Choose any existing evaluator — built-in or custom, numeric, categorical, or boolean.
Pick a **From** and **To** date/time — the historical window to score. "From" must be earlier than "To".
Enter an operation (e.g. `chat.completions.create`) or model name (e.g. `gpt-4o-mini`) to restrict scoring to a slice of that time range instead of everything in it.
Zespan resolves every matching trace and scores it with the same LLM-judge pipeline a live auto-evaluation run uses.
### Watching progress
Each run appears in the **Retroactive Runs** list with a progress bar and status label:
| Status | Meaning |
| --------------------------------- | ------------------------------------------------------------------------------------------------------------------------------------------------- |
| **Queued** | The run has been created and enqueued, not yet picked up. |
| **Running — X/Y traces scored** | The worker is actively scoring; X of Y matched traces are done so far. |
| **Completed — X/Y traces scored** | Every matched trace has been scored (or the run finished with zero matches). |
| **Failed** | The run couldn't complete — for example, no LLM connection was configured for the judge model. The failure reason is shown inline when available. |
The list refreshes automatically while any run is still **Queued** or **Running**, so you don't need to reload the page to watch a run finish.
A retroactive run's results land in the same score data as any other evaluator run, so they appear in that evaluator's trend chart and everywhere else its scores are shown — no separate "retroactive results" view to check.
Need a human to review traces directly instead of running them through an LLM judge — for calibration, or for cases too ambiguous to trust to a judge model? See [Annotation Queues](/dashboard/annotation-queues).
## Plan limits
| Plan | Auto-evaluation | Built-in templates | Monthly scored traces |
| ----- | ----------------------- | ------------------ | --------------------- |
| Free | Manual only | — | 500 |
| Solo | Included (12 templates) | 12 | 5,000 |
| Pro | Included | 12 + custom | 25,000 |
| Team | Included | 12 + custom | 100,000 |
| Scale | Included | 12 + custom | Unlimited |
This table covers auto-evaluation and template access, not evaluator management. Deploying a template into a live evaluator has no separate plan gate on any of the plans above (only the `evaluations:manage` permission). Using the **New Evaluator** dialog to create one directly, or editing/deleting any existing evaluator, requires the **Team** plan or above regardless of which plan row you're on.
Instead of guessing whether a prompt change improved quality, you define what "good" means numerically, run an evaluation, and see scores trend over time. Zespan uses an LLM-as-judge approach: your evaluator definition is a prompt that an AI model applies to each trace, producing a numeric score.
Auto-evaluations with 12 built-in LLM-as-judge templates are available on **Solo** and above. Manual evaluation runs are available on all plans including Free.
## How evaluations work
An **evaluator** (`EvaluatorDefinition`) is a named metric — at minimum a name, a metric key, and an optional description. When an evaluator runs (manually, on auto-run, or from a dataset-run score) against a trace, Zespan submits the trace's prompt/completion text to an LLM judge, which returns a numeric score. Scores are stored and displayed as trends on the Evaluations page.
There are two ways to get an evaluator with a real rubric:
* **New Evaluator dialog** — the fast path. It only collects Name, Metric Key, and an optional Description; it does not let you write a scoring prompt. An evaluator created this way scores traces using Zespan's generic default judge prompt ("evaluate output quality against input intent, score 0.0–1.0") rather than a rubric you author.
* **Templates → Deploy** — the path for a custom rubric, score range, and input scope. See [Custom evaluator templates](#custom-evaluator-templates) below.
You can also attach scores programmatically from the SDK using `span.setEvalScore()`, bypassing the judge model entirely. Both sources — programmatic and LLM-as-judge — appear in the same dashboard.
## Creating an evaluator
Navigate to **Evaluations** in the left sidebar.
The evaluator creation dialog opens.
Give it a name (e.g. `Factuality Check`) and a metric key (e.g. `custom_relevance`). The metric key becomes the identifier in trend charts. Optionally add a description.
Click **Save**. The evaluator appears in your evaluator list, ready to run with the default judge prompt described above.
If you need a custom scoring prompt, a specific score range, categorical/boolean verdicts, or an input scope (prompt vs. completion vs. both), don't use the New Evaluator dialog — create a [custom template](#custom-evaluator-templates) instead and deploy it. Deploying a template creates the same kind of evaluator, just with your rubric attached instead of the generic default.
Evaluations work on stored prompt and completion text. If you have disabled prompt storage with `storePrompts: false`, evaluation results will be empty — re-enable it to use evaluations.
Creating an evaluator via the New Evaluator dialog requires the **Team** plan or above. Deploying a template into an evaluator does not have this restriction — see [Custom evaluator templates](#custom-evaluator-templates). Editing or deleting an evaluator — however it was created — also requires **Team**. See [Plan limits](#plan-limits).
## Custom evaluator templates
Beyond the built-in library, you can author your own evaluator templates from the **Templates** tab on the Evaluations page. Built-in and custom templates live in the same catalog — you browse both, then deploy any of them into a live evaluator when you're ready. This is where you write an actual scoring prompt/rubric — the New Evaluator dialog above does not expose one.
Navigate to **Evaluations** and select the **Templates** tab.
The **Create Custom Template** dialog opens.
Give the template a name, and a category such as `quality`, `safety`, `performance`, `agent`, or `rag` — or type your own.
This is the rubric the judge model applies to each trace — describe what to look for and how to score it, the same way you would for a built-in template.
The metric key becomes the identifier for this evaluator in trend charts. The threshold (0.0–1.0) is the cutoff score above which a result counts as a pass.
Select how the judge should express its verdict:
* **Numeric** — a score between 0.0 and 1.0
* **Categorical** — the judge picks exactly one label from a list you define, entered as comma-separated values, e.g. `helpful, unhelpful, unclear`
* **Boolean** — a true/false verdict
Override the project's default judge model for this template alone. See [Overriding the judge model per template](#overriding-the-judge-model-per-template) below.
Use **Test on a real trace** to preview scoring before saving — see [Testing a template before you deploy it](#testing-a-template-before-you-deploy-it) below. When you're satisfied, click **Create Template**.
The new template appears in the catalog alongside the built-in ones. Click **Deploy** on its row to turn it into a live evaluator, the same way you would enable any built-in template.
### Overriding the judge model per template
By default, every evaluator uses your project's default judge model. When creating a custom template, you can pin a specific judge for that template instead: choose a provider — **OpenAI**, **Anthropic**, or **Google** — and enter the model name (for example `gpt-4o`, `claude-sonnet-4-20250514`, or `gemini-2.5-flash`). Leave the provider set to its default option to keep using the project's default judge model.
This lets you match judge cost and strength to the rubric — a cheaper, faster model for a simple pass/fail check, a stronger model for a template that requires nuanced judgment.
### Testing a template before you deploy it
Before saving a new template, use the **Preview & Test** panel in the creation dialog to see how it scores. Click **Test on a real trace** to submit your rubric, along with your most recently ingested trace, to the judge model synchronously. The result — a score and the judge's reasoning — appears in the dialog within a few seconds.
A dry run doesn't create an evaluator or save any results. It's a quick check that your rubric produces the score you expect before you commit to deploying it.
Every LLM-judge call — the template dry run above, auto-evaluation, a manual **Run now**, and the ad-hoc playground run described below — requires a project **LLM connection**. Without one, the call fails with "No LLM connection configured — add one in Settings → LLM Connections." Connect a provider key under [LLM Connections](/platform/llm-connections) before using any of these.
### Scope: trace vs. session
Every template above judges a single trace by default (`scope: "trace"`). Setting `scope: "session"` instead makes the deployed evaluator judge an entire conversation — every trace sharing a `sessionId`, folded into one ordered transcript — rather than one call in isolation. This is useful for quality signals that only show up across multiple turns, like the assistant contradicting itself or drifting off-topic over a long back-and-forth.
The **Create Custom Template** dialog doesn't expose a scope toggle yet, so set it via the API when creating or updating a template:
```bash theme={"theme":{"light":"github-light","dark":"one-dark-pro"}}
curl -X POST https://api.zespan.com/v1/projects/{projectId}/evaluation-templates \
-H "Authorization: Bearer $ZESPAN_API_KEY" \
-H "Content-Type: application/json" \
-d '{
"name": "Conversation coherence",
"category": "quality",
"evaluatorType": "llm_judge",
"metricKey": "conversation_coherence",
"defaultThreshold": 0.7,
"systemPrompt": "Judge whether the assistant stayed coherent across the whole conversation...",
"scope": "session"
}'
```
Deploy it from the **Templates** tab the same way as any other template — the scope carries over to the live evaluator automatically. A session-scope evaluator never scores an individual trace; it only runs once a session is detected as complete, and its results are written separately from per-trace scores (no `traceId`/`spanId`, a `sessionId` instead). See [Session-level evaluation](/dashboard/sessions#session-level-evaluation) for how "session complete" is detected and where these scores are surfaced.
## Running evaluations
After creating an evaluator, you run it against a selection of traces.
**Auto-evaluation:** Enable **Auto-run** on an evaluator to have it score every new trace automatically as it arrives. This is useful for monitoring ongoing quality in production.
**Manual run:** Click **Run now** on any evaluator to score a batch of recent traces immediately. You can choose how many recent traces to include (up to 500).
Both modes display results in the evaluator's trend chart within a few minutes of completion.
### Scoring a Playground response
You can also run an evaluator outside this page entirely: on the **Playground** page, each output window has a **Run Eval** action that lets you pick any evaluator from this project and score that window's prompt/response pair synchronously — useful for checking how an evaluator would score a draft response before it ever becomes a trace. Like every other judge call described above, it requires a project LLM connection.
## Sampling and filters for auto-evaluation
When an evaluator is running continuously against live traffic, you can scope exactly which traces it judges instead of scoring every single one. Open the **Evaluators** tab and click the gear icon next to an active evaluator to open **Sampling & Filters**.
You can configure:
* **Sample rate** — a fraction from 0 to 1 of matching traces to judge. Set it to `0.1`, for example, to evaluate roughly 1 in 10 matching traces and control judge-model cost; leave it at `1.0` to evaluate every eligible trace.
* **Minimum output tokens** — skip traces whose output is shorter than this token count, so trivially short responses don't consume judge calls.
* **Models** — a comma-separated list of model names to restrict evaluation to, e.g. `gpt-4o, claude-sonnet-4-20250514`.
* **Operations** — a comma-separated list of operation types to restrict evaluation to, e.g. `chat, completion`.
* **Statuses** — a comma-separated list of trace statuses to restrict evaluation to, e.g. `success`.
Leave any filter blank to match everything. Use the **Sampling Enabled** toggle to turn sampling on or off without losing your configured values, then click **Save** to apply.
Combine sampling and filters to scope auto-evaluation to the slice of traffic you actually care about — for example, judge only 20% of `chat` operations on your production model, skipping short responses that wouldn't produce a meaningful score.
## Reading evaluation results
A **categorical** or **boolean** evaluator (see [Custom evaluator templates](#custom-evaluator-templates)) displays its result as the judge's chosen label, or `true`/`false`, in the **Evaluators** table on the trace detail view. It no longer renders as a 0–100% bar there: a percentage has no meaning for a label like `helpful` or a boolean verdict. This is scoped to that one surface — the cards and tables on this page, and the generic score chip used elsewhere, still show a raw percentage regardless of score type. Numeric evaluators are unaffected everywhere and still show a 2-decimal score with the usual progress bar.
The main Evaluations page shows all your evaluators as cards. Each card displays:
* **Name** — the evaluator identifier
* **Latest score** — the most recent average score across the last batch of evaluated traces
* **Trend** — a sparkline showing how the score has changed over the last 30 days
* **Sample count** — how many traces were scored in the latest run
Click an evaluator card to open the full detail view with:
* A time-series chart of average score by day
* A distribution histogram showing score spread
* A table of individual trace scores with links to the trace detail view
If your evaluator score drops sharply after a deployment, open the **Traces** page and filter to the same time window. The evaluation score is shown in the trace detail panel so you can correlate low-scoring traces with specific model calls.
## Evaluating RAG pipelines
If your traces include retrieval spans — captured automatically by `recordRetrieval()`, the LangChain integration, or attached manually via `span.recordDocuments()` (`span_kind: "retriever"`) — five evaluator templates can score the retrieval step itself, not just the final answer:
| Template | What it checks | Requires retrieved chunks |
| ----------------------- | ------------------------------------------------------------------------------------------------------------------------------------- | ------------------------- |
| **Groundedness** | Whether the response is supported by whatever context is available — retrieved chunks if present, the trace's system prompt otherwise | No — degrades gracefully |
| **RAG Faithfulness** | Whether every claim in the response is specifically supported by the retrieved chunks | Yes |
| **Context Relevance** | Whether the retrieved chunks are actually relevant to the query — judges the retriever, independent of the generated answer | Yes |
| **Context Utilization** | What fraction of retrieved chunks were actually used in the response | Yes |
| **Retrieval Hit Rate** | Deterministic, no LLM call — did the retriever return anything at all | Yes |
All five are reference-free, like every other evaluator on this page — no ground-truth answer set required. Deploy any of them from the **Templates** tab under the **RAG** category, the same way you'd deploy any built-in template.
The four RAG-specific templates — everything except Groundedness — only score traces that actually have a retrieval span with chunks. A trace with no retrieval step is skipped for these evaluators entirely: no score row, no LLM call, no cost, rather than a meaningless score against nothing.
## RAG analytics
The **Retrieval** tab on this page rolls RAG evaluator scores up across traces: a trend card per metric, and a ranked list of your worst-performing retrieval operations — the fastest way to spot a retriever that's degraded on one specific operation before it shows up as a wave of bad answers.
If Retrieval Hit Rate is trending down on an operation, check that first. A faithfulness or context-relevance drop is often downstream of the retriever returning nothing, not the judge model getting worse.
## Attaching scores from the SDK
You can attach evaluation scores to any span programmatically using `span.setEvalScore()`. This is useful when you compute quality scores in your own code — for example, using a custom similarity function for RAG faithfulness.
```typescript theme={"theme":{"light":"github-light","dark":"one-dark-pro"}}
import { zespan, startSpan } from "@zespan/sdk";
const { span } = startSpan({ name: "rag-pipeline", provider: "custom" });
try {
const answer = await generateAnswer(query, docs);
// Attach your computed scores before closing the span
span.setEvalScore("faithfulness", computeFaithfulness(answer, docs));
span.setEvalScore("relevance", computeRelevance(answer, query));
await span.end({ status: "success" });
return answer;
} catch (err) {
await span.end({ status: "error", error_message: String(err) });
throw err;
}
```
```python theme={"theme":{"light":"github-light","dark":"one-dark-pro"}}
from zespan import start_span
with start_span(name="rag-pipeline", provider="custom") as span:
answer = generate_answer(query, docs)
span.set_eval_score("faithfulness", compute_faithfulness(answer, docs))
span.set_eval_score("relevance", compute_relevance(answer, query))
```
Scores attached via the SDK appear in the same trend charts as LLM-as-judge scores. If you attach a score with the same name as an evaluator, both sources are shown together in the detail view — and, as of this dashboard's KPI tiles and metric list, in the aggregate too: `setEvalScore()` results and server-side judge results for the same metric key are combined into one count-weighted average per time bucket rather than only ever appearing in the raw per-trace view. No setup is required on your side; this happens automatically the moment a span carries an eval score.
## Performance & agent evaluators
Four built-in templates score performance and agent-trajectory signals directly from trace data — no LLM call, no judge cost:
| Template | Metric key | What it checks | Requires |
| ----------------------- | --------------------- | ------------------------------------------------------------------------------------------------------------------------------------------- | ---------------------------------- |
| **Latency SLA** | `latency_sla` | Whether the span's `latency_ms` is within a target (default 5000ms) | The span's latency to be recorded |
| **Cost Budget** | `cost_budget` | Whether the span's `cost_usd` is within a budget (default \$0.05) | The span's cost to be recorded |
| **Loop Detection** | `loop_detection` | The longest run of consecutive identical operations across the trace's spans so far — a sign of an agent stuck repeating the same tool call | At least 2 spans in the trace |
| **Error Recovery Rate** | `error_recovery_rate` | Of the trace's error spans, what fraction were followed later by a successful call to the same operation — a retry-and-recover pattern | At least 1 error span in the trace |
Each is a real deterministic check against the trace's own data (`latency_ms`, `cost_usd`, `operation`, `status`) — not a generic LLM quality-judge rubric scoring "output quality" in the abstract. **Loop Detection** and **Error Recovery Rate** skip a trace entirely (no score row, no cost) when there isn't enough signal yet — fewer than 2 spans, or no error spans respectively — rather than fabricate a score against nothing.
`slaTargetMs` (Latency SLA) and `budgetUsd` (Cost Budget) use fixed defaults (5000ms / \$0.05) for every evaluator deployed from these templates. There's no dashboard control to change these per-evaluator yet — reach out if you need a different threshold.
## Retroactive evaluation
An evaluator only auto-scores traffic from the moment it's turned on — but you don't need to have predicted which metric you'd want in advance. The **Retroactive Runs** panel on this page scores historical traces you've already ingested against any evaluator, including one that wasn't configured for auto-run (or didn't exist yet) when that traffic actually happened.
Opens the retroactive-run dialog. Requires at least one evaluator to already exist.
Choose any existing evaluator — built-in or custom, numeric, categorical, or boolean.
Pick a **From** and **To** date/time — the historical window to score. "From" must be earlier than "To".
Enter an operation (e.g. `chat.completions.create`) or model name (e.g. `gpt-4o-mini`) to restrict scoring to a slice of that time range instead of everything in it.
Zespan resolves every matching trace and scores it with the same LLM-judge pipeline a live auto-evaluation run uses.
### Watching progress
Each run appears in the **Retroactive Runs** list with a progress bar and status label:
| Status | Meaning |
| --------------------------------- | ------------------------------------------------------------------------------------------------------------------------------------------------- |
| **Queued** | The run has been created and enqueued, not yet picked up. |
| **Running — X/Y traces scored** | The worker is actively scoring; X of Y matched traces are done so far. |
| **Completed — X/Y traces scored** | Every matched trace has been scored (or the run finished with zero matches). |
| **Failed** | The run couldn't complete — for example, no LLM connection was configured for the judge model. The failure reason is shown inline when available. |
The list refreshes automatically while any run is still **Queued** or **Running**, so you don't need to reload the page to watch a run finish.
A retroactive run's results land in the same score data as any other evaluator run, so they appear in that evaluator's trend chart and everywhere else its scores are shown — no separate "retroactive results" view to check.
Need a human to review traces directly instead of running them through an LLM judge — for calibration, or for cases too ambiguous to trust to a judge model? See [Annotation Queues](/dashboard/annotation-queues).
## Plan limits
| Plan | Auto-evaluation | Built-in templates | Monthly scored traces |
| ----- | ----------------------- | ------------------ | --------------------- |
| Free | Manual only | — | 500 |
| Solo | Included (12 templates) | 12 | 5,000 |
| Pro | Included | 12 + custom | 25,000 |
| Team | Included | 12 + custom | 100,000 |
| Scale | Included | 12 + custom | Unlimited |
This table covers auto-evaluation and template access, not evaluator management. Deploying a template into a live evaluator has no separate plan gate on any of the plans above (only the `evaluations:manage` permission). Using the **New Evaluator** dialog to create one directly, or editing/deleting any existing evaluator, requires the **Team** plan or above regardless of which plan row you're on.